
Polar Equations
By: Ginger Rhodes
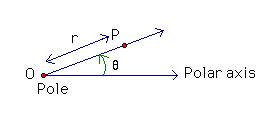
What are polar equations? A point P in a polar coordinate system is the ordered
pair (r, q),
where r is the distance from the pole to the point and q is the angle formed by the by the polar axis and a
ray from the pole through the point.
So (r, q) is called the polar coordinates of the point.
An equation whose variables
are polar coordinates is called a polar equation.
These polar equations can
create some interesting graphs. Let’s investigate!
Since (r, q) is the ordered pair for polar coordinates, I will
begin by exploring some fundamental polar equations. For example, what do the
equations r = 2 and q = p/4
look like?
r = 2 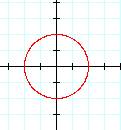 q = p/4
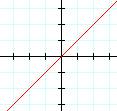
These make sense because r =
2 represents a circle with radius 2 and q = p/4 represents a line that makes an angle of p/4 or 45° with the polar axis.
Now, I will look at the more
interesting polar equations.
For example, what does r = a
+ b cos (kq)
and r = a + b sin (kq) look like, when a = b = k = 1?
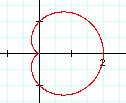
r = a + b cos (kq) r = a + b sin (kq)
It’s a limacon!
Notice both equations have the
same shape and size, but are rotations of each other. For this reason I will
only explore properties of
r = a +b sin (kq).
What happens if the values of
a and b change, but k still equals 1?
There are two possible cases.
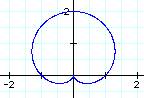
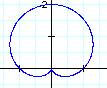
CASE 1: 0 < a < b
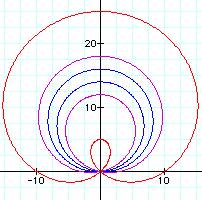
What happened? It looks like there is an inner loop,
and the loop gets smaller as a approaches b.
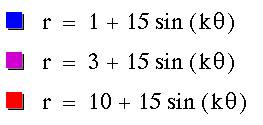
CASE 2: 0 < b < a
There is no inner loop and as
b approaches a it appears to be a circle.
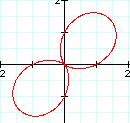
Next, I will investigate what
happens as k varies. Let a = b = 1.
![]()
![]()
Looks like a Lemniscate!
![]()
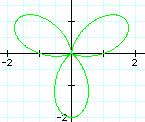
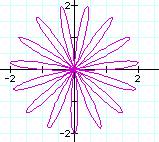
It’s starting to look like a flower! Any
conjectures? It seems the k value represents the number of leafs in the n-leaf
rose. What do you think the value of k is in the following graph? Click HERE for the answer.
What
is the relationship between the graphs of r = a + b sin (kq) and r = b sin (kq)? I will begin by
letting a = b = k = 1.
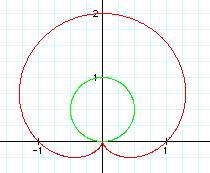
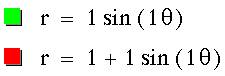
It looks like the green graph is a circle. What happens when k changes?
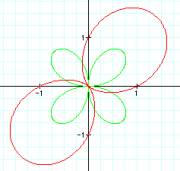
Any
conjectures? Here are some more examples:
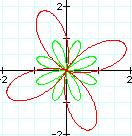
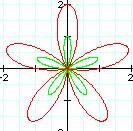
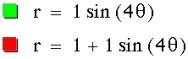
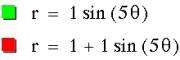
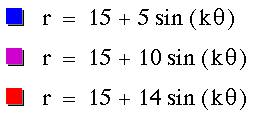
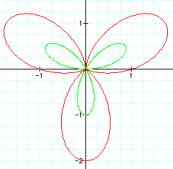
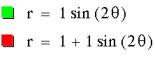
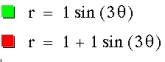
When
the polar equation is r = sin (kq) it appears there are k
petals when k is odd and 2k petals when k is even. In comparison r = 1 + sin (kq) there seems to always
be k petals. When k is odd the petals of r = sin (kq) are inside of r =
1+sin (kq). See to more petals form click HERE.
What happens for 0 < k <
1? Click HERE for an animation.