Thomas Earl Ricks
Assignment 1
The assignment for Assignment #1, number 6. is the
following:
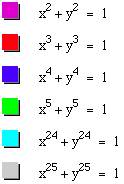
Graph:
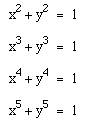
What do you expect of :

Upon graphing the following…
we obtain the following graph:
Upon observation, we would therefore expect the graph
of:
![]()
to more closely approximate the unit square. We deduce this because the graph is
even powered, as is the other two even powered graphs. As the power increases, we would expect
it to look more and more like a unit square, as if a balloon were expanding in
a unit box. Upon graphing, it
does! (see below)
![]()
![]()
![]()
And upon observation of the odd powered graphs it
appears that
![]()
would more approximate the function:
y = x
combined with the horizontal line at x=1 from
-1<y<1
And upon graphing, it does!
![]()
![]()
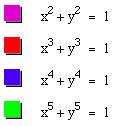
All the combined graphs look like the following:

Another look at even powered graphs
From our observation of even powered graphs, it
appears that we can form a conjecture that as the power increases, the graph
more approximates the unit square.
If we graph:
![]()
we can see from this high-powered even example that it
appears our conjecture may be correct:
![]()
![]()
![]()
![]()
The corners are what appear to be interesting
areas. Let us zoom into the upper
right corner:
Now let us use the enormous power of the computer to
graph
![]()
And we get:
This new graph is a very close approximation to the
unit square!
Just for fun, let us look at some 3d graphs of even
and odd powers!
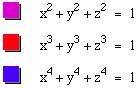
The blue graph is shown slightly transparent so the
inner purple graph can be seen. We
might conjecture from the two even graphs that the higher power the even power,
the more the graph approaches the unit square!
That is left for you to explore!