
Thomas Earl Ricks
Mathematics Education
Assignment # 11
“Polar Equations”
Assignment #11
Investigation #3
Investigate with different values of p:
For k > 1, k =1, k < 1.
Note: The
parameter k is called the “eccentricity” of these conics. It is usually called “e” but for many
software programs e is a constant and cannot be set as a variable.
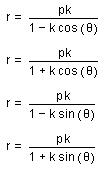
We will begin our investigations by looking at all four
graphs in unison for a set value of p, and varying the eccentricity parameter
k. Then we will investigate one
graph in more depth.
Setting p = 1 and k = 1 yields:
Notice that each appears to be a parabola, with the
sine equations being up and down facing parabolas, and the cosine graphs left
and right.
Dropping k < 1 yields ellipse shapes of various
kinds.
For p = 1 and k = .7 we get:

Dropping k even further has the ellipses approach a
circle.
For p =1 and k = .3 we get:

Thus as k approaches zero, the graphs not only shrink
in size, but approximate a circle more and more. Let us zoom in to observe the more circular shape:
What would you predict to happen if we raised k above
1?
If you guessed a hyperbola, you are right!
We will observe just the first graph as it will be
confusing to interpret four overlapping hyperbolas all at once.
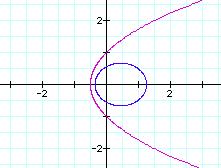
If p = 1 and k = 1.3 we get:
![]()
As we increase k, the hyperbola becomes more and more
“steep” as in the example below where k = 2
![]()
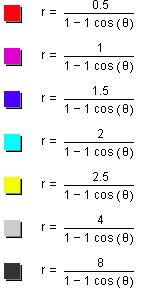
We could observe the change in the shape of the graphs
as k changes from below 1 to above one in the graph below:
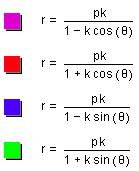
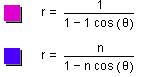
Or if you wish to see a movie as the value of k varies
between .1 and 2, click here. The graph with k =1 is given in purple
as a reference graph.
Now let us investigate what happens to a specific
graph as p is varied. Can you
create a rough guess of what you think will happen? Will it shift, expand, contract?
Let us one polar equation and vary p (holding k
constant at k = 1):
![]()
We will graph various values for p. When we do this we observe:
It appears that the p values changes the “steepness” of
the graph, at least for a parabola.
What about for an ellipse?
Thus for a value of k < 1, say k = .5, we vary the p value for
several graphs and obtain:
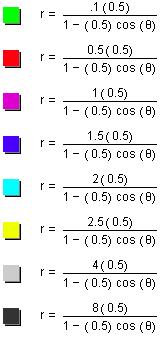
It appears that the right side of the ellipse goes
through the p value on the x-axis.
Can you explore hyperbolas and determine what varying
p does to them?
Have fun!
For more information on eccentricity, click here.
For more information on how to derive these polar
equations from the rectangular conic formulas, click here.