
Thomas Earl Ricks
Mathematics Education
Assignment # 2
“Ellipsoids and Such..”
For this Write-up, I have selected problem
10 from Assignment #2. It reads in part:
Graph
![]()
Now, on the same axes, graph
![]()
Describe the new graph. Try
different coefficients for the xy term. What kinds of graphs do you
generate? What coefficients mark the boundaries between the different
types of graphs? How do we know these are the boundaries? Describe
what happens to the graph when the coefficients of the xy term is close to the
boundaries.
We thus begin the explorations.
Upon graphing the first two graphs we get:
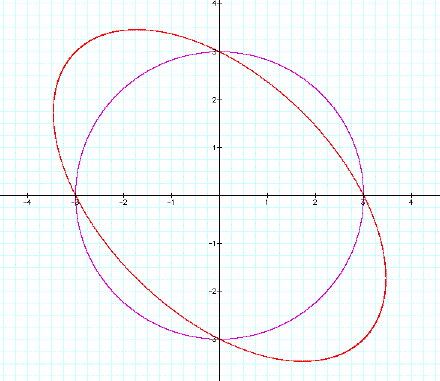
We therefore observe that adding the xy
term skews the circle along the line
y=-x
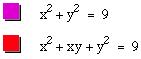
Curiosity would suggest we try:
![]()
which yields the graph stretched along y=x

![]()
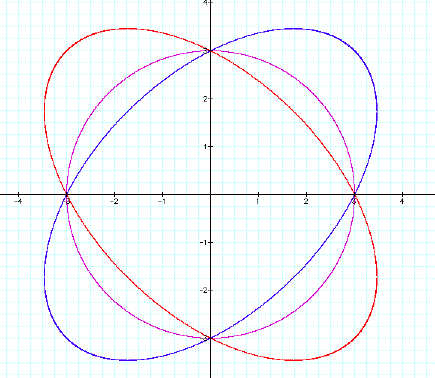
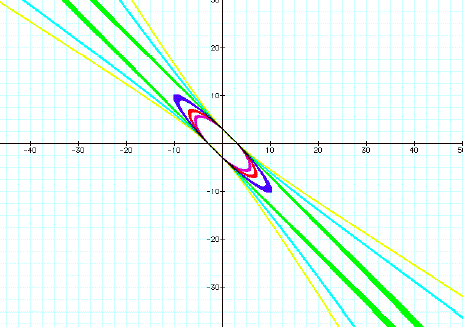
We now turn our attention to other possible
coefficients and obtain the following graphs for positive xy coefficients:
Thus the higher the coefficient, the more
the graph looks like the axes. It appears that two types of graphs are created
by varying the coefficient: One piece (elliptical) graphs, and two piece
(hyperbolic) graphs. It appears the split between the two graphs occurs around
the coefficient 2.
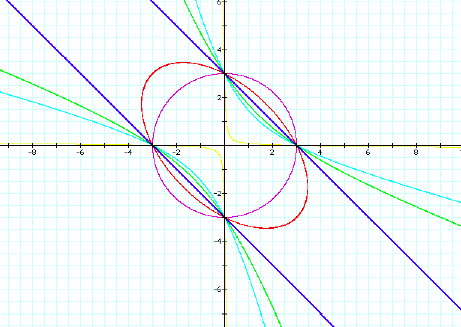
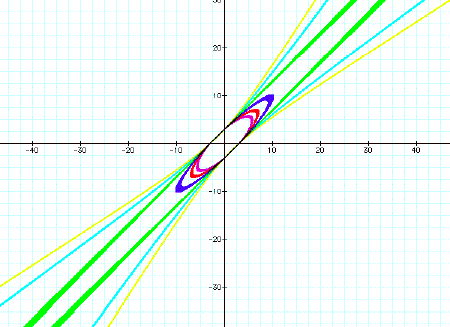
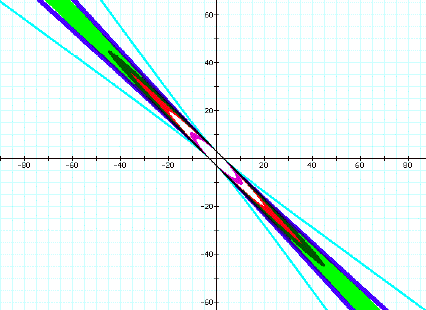
Looking at coefficients near 2 this
assumption appears correct:
The coefficients less than 2 seem to curl
into an ellipse, while those greater than 2 seem to bend outward like a
hyperbola. Similar graphs are obtained for negative coefficients:
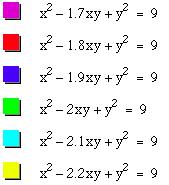
Thus –2 appears to be the dividing number
for the negative coefficients. The computer has trouble graphing values
very close to 2 or –2, as can be seen in the graph below, which is
distorted. It has limits on its computational abilities:
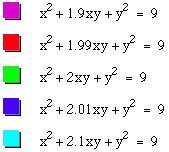
But we can still observe that the 1.99
coefficient stays elliptical, while the 2.01 begins to branch out. Thus
we assume 2 is the limit of the boundaries.