Lissajous Curves
By
Janet Shiver
EMAT 6680
Lissajous curves are the family of curves described by the parametric equations
x(t) = a sin(nt +c)
y(t) = bsin(t)
The curves are named after Jules-Antonie Lissajous
(1822-1880) who discovered the curves (in 1857) while doing experiments involving
sound vibrations. They are also sometimes referred
to as Bowditch curves after the American mathematician Nathaniel Bowditch(1773-1838). He is said to have discovered the curves while studying
pendulums in 1815. These curves have applications in
physics, astronomy, mathematics and other sciences.
Investigation: Consider
the Lissajous curves of the form x(t) = 4sin((p/q)t) and y(t) = 3sin(t).
Graph these curves for various values of p and q where
0 < p/q < 1. Finally,
compare the graphs of these curves with the graphs formed by the equations
x(t) = sin(pt) and y(t) = sin(qt).
Let’s begin our investigation by looking at some curves. We
will start our investigation by assigning p=1 for all of the curves and vary
only the q value.
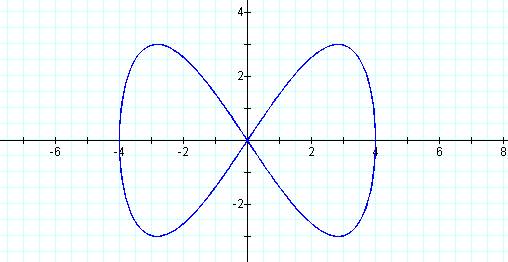
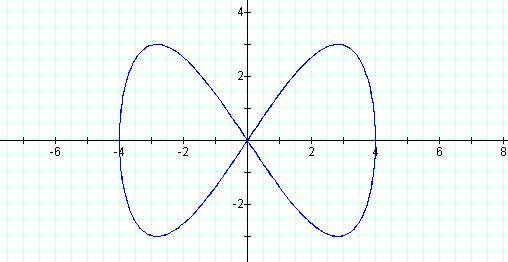
Graph of curve when p = 1 and q =2
This graph is a closed figure with a “bow-tie”
appearance that reaches 2 peaks.
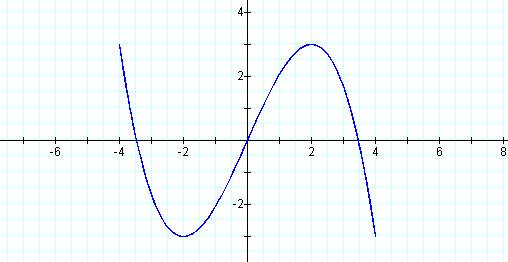
Graph of curve when p = 1 and q = 3
This graph is not closed and appears to have a
cubic shape.
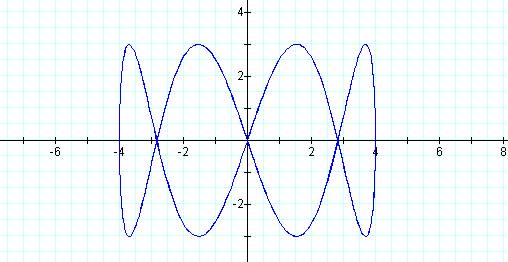
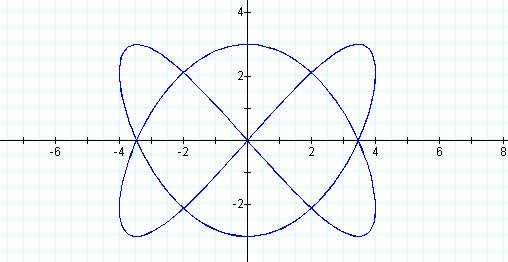
Graph of curve when p =1 and q = 4
This graph is a closed figure and has 4 peaks.
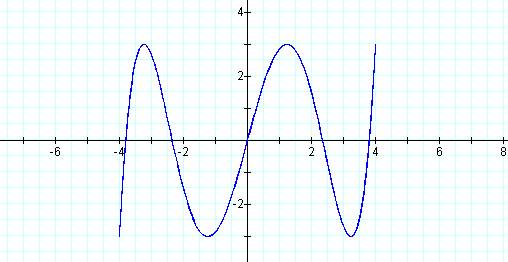
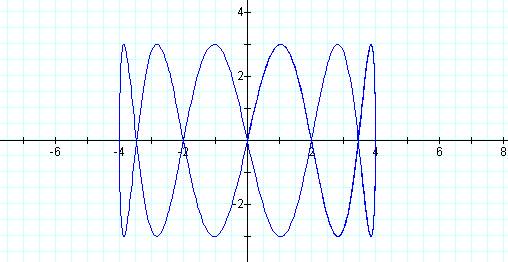
Graph of curve when p = 1 and q = 5
This graph is not closed and appears to have the
shape of the graph of a degree five polynomial.
Graph of curve when p = 1 and q =6
This graph is a closed figure and reaches 6 peaks.
As we continue graphing equations of this form, we see that a clear pattern develops. When q is an even number the curve is closed and it reaches q peaks. For example, when p =1 and q=4 the graph had 4 peaks. When q is an odd number the curve is not closed and, if the endpoints are counted, it reaches (q+1)/2 peaks. For example, when p = 1 and q = 5, the graph reached (5 + 1)/2 or 3 peaks.
Next, let’s investigate what happens when both
p and q vary. First let’s look at the case where one number is odd while
the other is even. Remember that we are restricting
our investigation to values of p/q that are less than one.
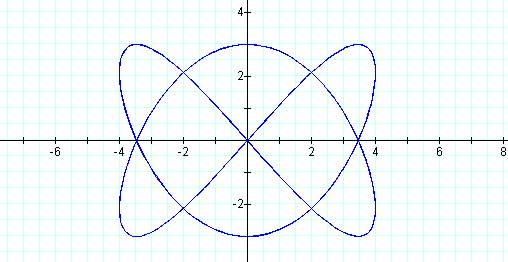
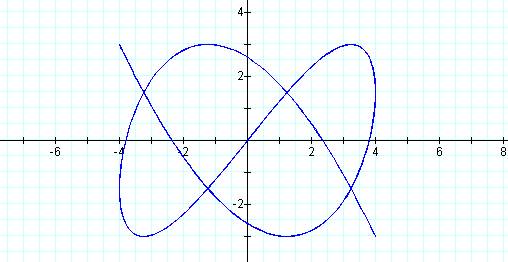
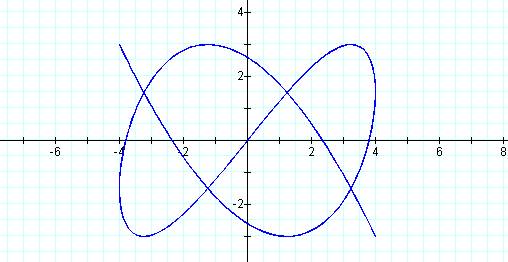
Graph of curve when p = 2 and q = 3
This graph is a closed figure reaching three peaks
on top (and bottom) and with two “bumps” on the right and left sides.
Graph of curve when p
= 3 and q = 4
This graph is a closed figure reaching four peaks on top and with three“bumps” on the side.
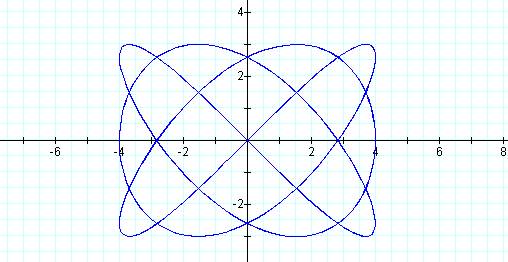
Graph of curve when p = 5 and q = 6
This graph is a closed figure reaching six peaks
on top and with five “bumps” on the side.
As we continue graphing equations of this form, we see that a clear pattern develops. When q is an even number and p is odd, or when q is odd and p is even, then the curve is closed. We can also see that the graph reaches q peaks on top and bottom while it has p “bumps” on the side. For example, when p =2 and q=3 the graph had 3 peaks and 2 bumps.
Now let’s investigate graphs formed when both p
and q are odd.
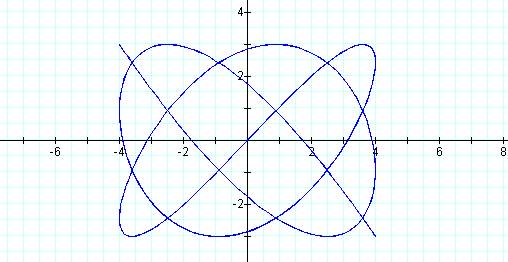
Graph of curve with p = 3 and q = 5
The graph is an open figure with three peaks and
two “bumps” on the side. (Remember to count the endpoints)
Graph of curve with p=5 and q = 7
The graph is an open figure with 4 peaks and three
“bumps” on the side.
It appears that when p and q are odd numbers the curve is not closed. It also appears that these curves reach (q+1)/2 peaks and have (p+1)/2 bumps, if the endpoints are counted.
Let’s take a closer
look at the peaks and bumps of the curves formed when p is odd and q is even
or vice-versa. To do this we will follow the equation
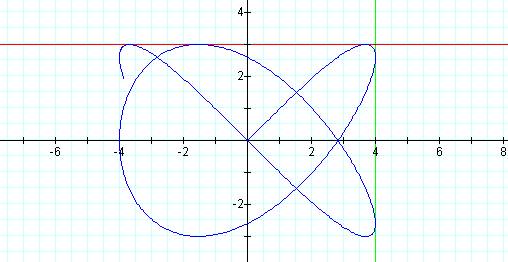
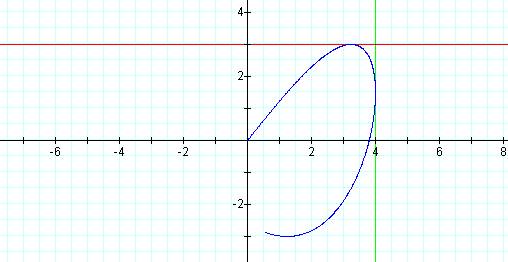
when p = 3 and q = 4 for changing values of t. We
will also graph the lines y = 3 and x = 4 for reference.
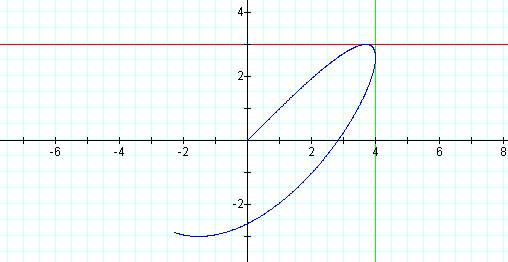
Graph of curve with p = 3, q = 4 and t =5
Notice that, as
the path of the graph is traced, it touches both lines in exactly one place.
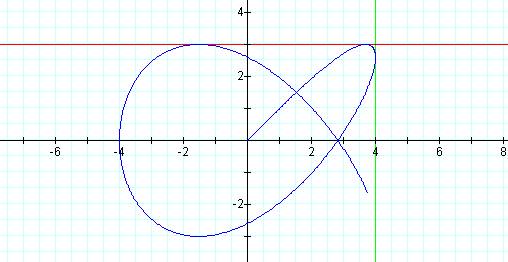
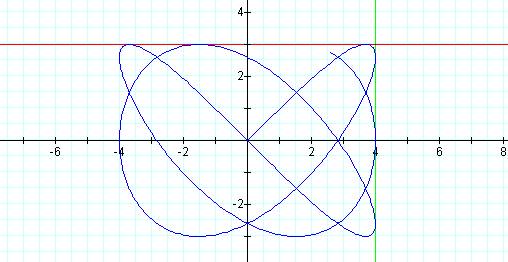
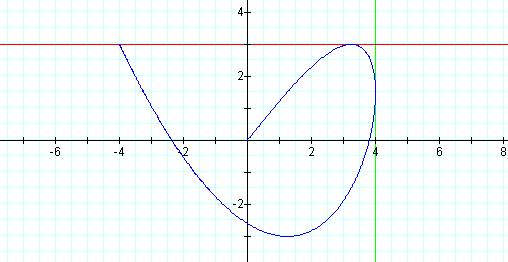
Graph of curve with p = 3, q = 4 and t =10
Notice that the
graph has intersected the line y=3 a second time.
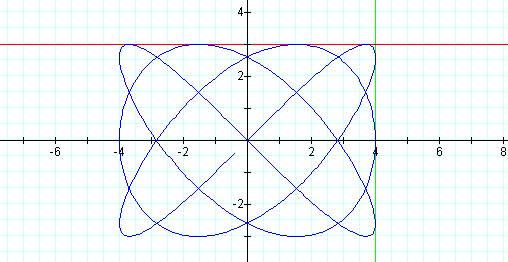
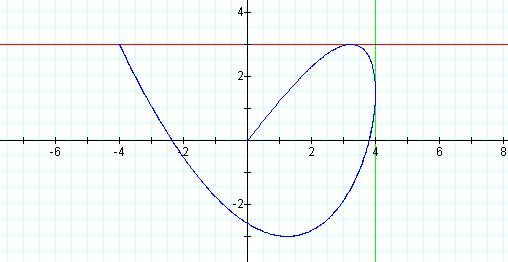
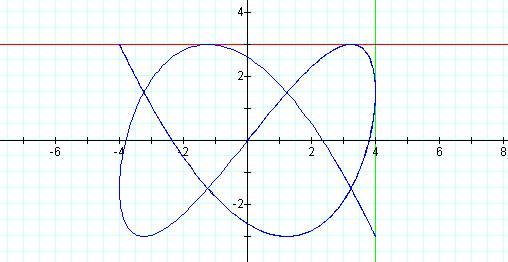
Graph of curve with p = 3, q = 4 and t =15
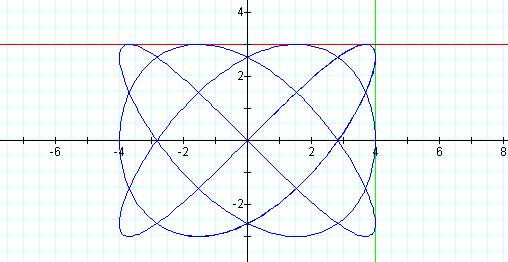
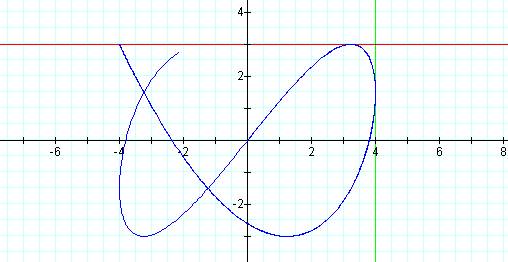
Graph of curve with p = 3, q = 4 and t =20
Graph of curve with p = 3, q = 4 and t =25
Graph of curve with p = 3, q = 4 and t =30
By adding the lines y = 3 and x = 4 to our graph
we can see that the peaks and bumps are actually points of tangency to these
two lines. As this graph was traced it touched the
y = 3 line four times while it touched the x = 4 line 3 times. Also, notice that the graph is symmetric to both the x
and y axis so that y = -3 and x =-4 are also tangent lines to the curve.
Let’s take a closer look at the peaks and bumps
of the curves formed when both p and q are odd. To
do this we will follow the equation when p = 3 and q = 5 for changing values
of t. We will also graph the lines y = 3 and x = 4
for reference.
Graph of curve with p = 3, q = 5 and t
= 5
Notice that, as the path of the graph is traced,
it touches both lines in exactly one place.
Graph of curve with p = 3, q = 5 and t = 10
Graph of curve with p = 3, q = 5 and t = 15
Note: This graph appears
to be the same as the graph for t = 10 but on closer examination it can be
seen that the graph is actually retracing itself.
Graph of curve with p = 3, q = 5 and t = 20
Graph of curve with p
= 3, q = 5 and t = 25
By adding the lines y = 3 and x = 4 to our graph we can see that the peaks and bumps are actually points of tangency to these two lines. As this graph was traced (and retraced) it touched the y = 3 line five times while it touched the x = 4 line 3 times. Also, notice that although the graph is not symmetric to the x and y axis, the lines y = -3 and x =-4 are also tangent lines to the curve.
So what happens as the value of p/q approaches one? Let’s
investigate.
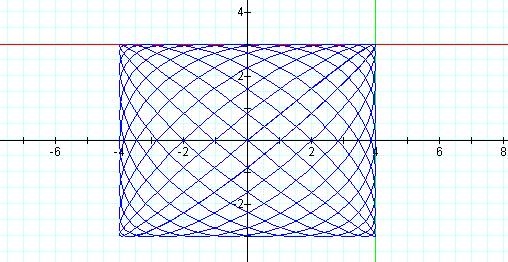
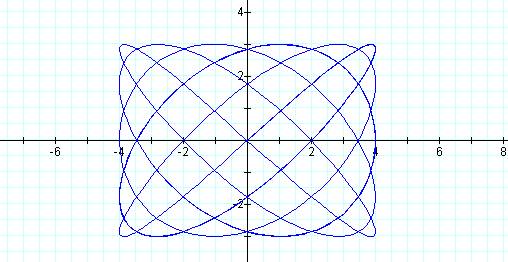
Graph of the curve with p = 11 and q = 12
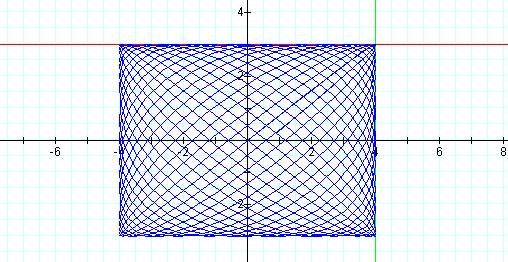
Graph of the curve with p =20 and q = 21
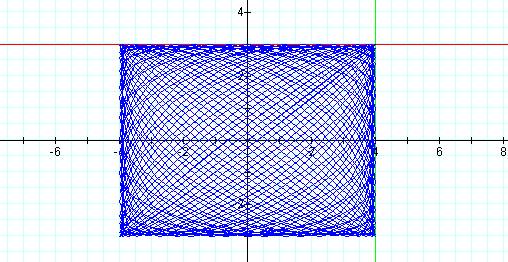
Graph of the curve with p = 39 and q =40.
It appears that as the value of p/q approaches one, the graph of the curve becomes a rectangle with dimension 4 units by 3 units, the coefficients of the equation.
Finally, lets compare our
original graphs to the graphs formed by the equations
x = 4 sin((p)t) and y = 3sin((q)t).
Graph of curve when p = 1 and q = 2.
This curve resembles the original curve formed
when p = 1 and q = 2.
Graph of curve when p = 2 and q = 3.
This curve resembles the original curve formed
when p = 2 and q =3.
Graph of curve when p =3 and q =5
Once again we have a match!
It appears that the graphs formed by the parametric equation x = 4 sin((p)t)
and y = 3sin((q)t) will yield the same results as those constructed from
x(t) = 4sin((p/q)t) and y(t) = 3sin(t).
Return to Janet Shiver’s Home Page