Explorations of Quadratic
Equations
By
Janet M. Shiver
EMAT 6680
![]()
Investigation
1: Construct graphs of the equation ![]() for different values of b as
a and c are held constant. Discuss the movement of
the parabola as b is changed. Finally, discuss the locus of points determined
by the vertices of the set of parabolas graphed.
for different values of b as
a and c are held constant. Discuss the movement of
the parabola as b is changed. Finally, discuss the locus of points determined
by the vertices of the set of parabolas graphed.
![]()
We will begin our investigation
by plotting the equation ![]() . We will set the values of a and c to be one while the
value of b will vary.
. We will set the values of a and c to be one while the
value of b will vary.
![]()
From this graph we can see
that all of the parabolas pass through the y –intercept.
For this particular equation this point is located at (0,1). Algebraically , this point can be found by setting x equal
to zero which gives us ![]() or when simplified y =1.
or when simplified y =1.
We can also see that several of the graphs intersect the x-axis as well. For b < -2 and b>2 it appears that the graph crosses the x-axis in two points indicating that the equation has two real solutions. For b = -2 or b = 2, we see that the graph is touching the x-axis in exactly one point, indicating that there is one distinct real root. For –2 < b < 2, we see that the graphs of the parabolas do not intersect the x-axis. This tell us that no real roots exist for these equations.
![]()
Now we will consider the locus of points formed by
the vertices of the parabolas graphed from ![]() .
.
The x coordinate of the vertices of the parabolas
can be found by using ![]() . We can then find the y value using substitution.
. We can then find the y value using substitution.
So the vertex of any parabola can be expressed as
the ordered pair  .
.
Thus the parabolas we have already graphed will have the following vertices:
(-3/2,-5/4), (-1,0), (-1/2,3/4), (0,1), (1/2,3/4), (1,0), (3/2,-5/4)
It appears that the locus of points formed from the vertices of the parabola is also a parabola.
Using the formulas we obtained for the x and y coordinates, we will determine the equation for the locus of points formed from the vertices of the parabola.
Solve each equation for b.
Since each equation is equal to b, we will now set them equal to each other. By solving this newly formed equation for y we will obtain the equation for the locus of points of the parabola formed by the vertices.
Since a =1 and c =1 then we obtain the equation ![]() .
.
![]()
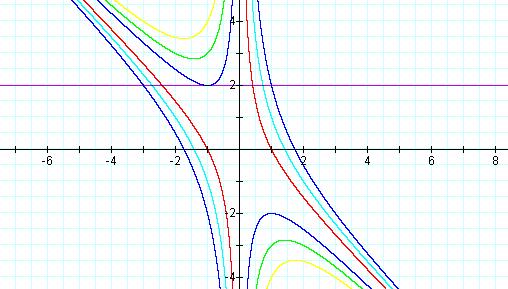
Investigation 2: Graph the equations above in the xb plane.
![]()
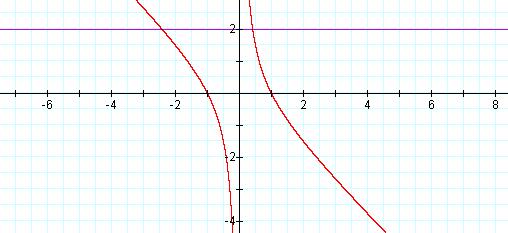
Lets look at the equation ![]() again but this time lets graph it in the xb plane.
again but this time lets graph it in the xb plane.
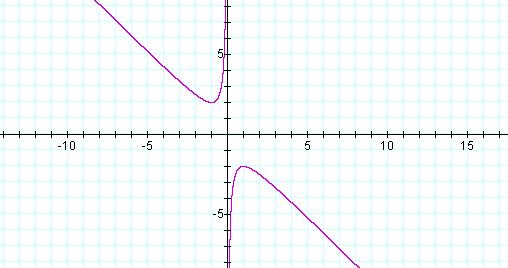
b= -x –1/x
If we choose a value for b, say b = 3 and graph it. We see that the line intersects the hyperbola in exactly two points, showing us that there exist exactly two real roots for this equation.
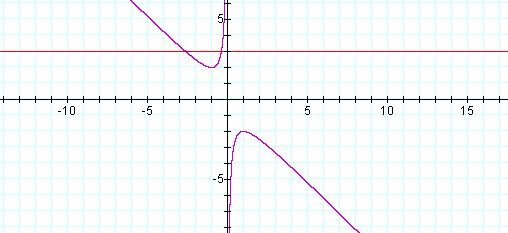
For each value
of b we select, we will get a horizontal line. The
intersection of this line with the graph of ![]() is the xb plane will correspond
to the roots of the original equation for that value of b.
For the graph above, it is clear that for b>2 or b<-2 the line
will intersect the graph twice providing us with two real roots. For b = 2 or b = -2, the line will intersect in only one
point indicating that there exist only one real root at this point. Finally,
for –2<b<2, there is no intersection indicating that there are no real
roots for these values of b. Looking at the quadratic equation when c =1,
is the xb plane will correspond
to the roots of the original equation for that value of b.
For the graph above, it is clear that for b>2 or b<-2 the line
will intersect the graph twice providing us with two real roots. For b = 2 or b = -2, the line will intersect in only one
point indicating that there exist only one real root at this point. Finally,
for –2<b<2, there is no intersection indicating that there are no real
roots for these values of b. Looking at the quadratic equation when c =1,
 , we can clearly see that the discriminant (
![]() )
will always be negative for –2<b<2 indicating that there will be no
real roots for this equation for these values of b.
)
will always be negative for –2<b<2 indicating that there will be no
real roots for this equation for these values of b.
Consider the case where c = -1. Graphing
the equation ![]() it becomes clear that there are two real roots for any
value of b when c = -1. Looking at the quadratic equation when c =-1,
it becomes clear that there are two real roots for any
value of b when c = -1. Looking at the quadratic equation when c =-1,  , we can clearly see that the discriminant (
![]() ) will always be positive indicating that there will
always be two real roots for this equation no matter what value of b is selected.
) will always be positive indicating that there will
always be two real roots for this equation no matter what value of b is selected.
Graphs of the equations ![]() for c =1, 2, 3, -1, -2, -3.
for c =1, 2, 3, -1, -2, -3.
Now lets add the graph when c = 0.
It appears that the hyperbolas graphed above are asymptotic to the line formed when c = 0 as well as, to the y-axis.
![]()
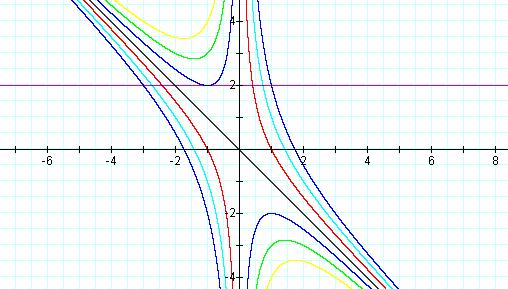
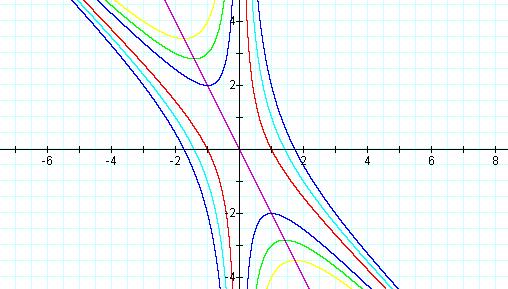
Investigation
3: Add the graph of 2x+b = 0 to the picture above and discuss its relation
to the quadratic formula.
Notice
that this line is passing through the vertices of several of the parabolas. This line must therefore indicate the point where the
discriminant ( ) is zero
and thus where the equations have a single real root.
) is zero
and thus where the equations have a single real root.
![]()
Investigation 4: Consider the graph in the xc plane.
![]()
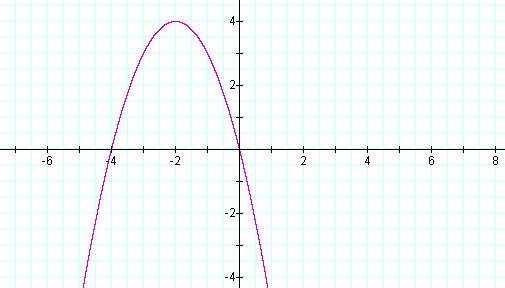
![]()
Solving the equation ![]() , where a = 1 and b =4, for c gives us
, where a = 1 and b =4, for c gives us ![]() . This is a quadratic equation
and therefore its graph will be a parabola. By considering different values
of c and graphing them as horizontal lines we can clearly see that they will
either intersect in zero, one or two points on the parabola. For c >4
the equation will have two imaginary roots, for c=4 it will have one real
root, and for c <4 there will be two real roots.
. This is a quadratic equation
and therefore its graph will be a parabola. By considering different values
of c and graphing them as horizontal lines we can clearly see that they will
either intersect in zero, one or two points on the parabola. For c >4
the equation will have two imaginary roots, for c=4 it will have one real
root, and for c <4 there will be two real roots.
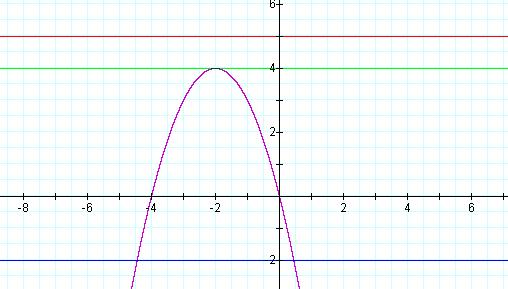
To relate this to the quadratic formula, lets consider what happens at c. For this equation, the discriminant would be 16 – 4(1)(c). We can clearly see that if the value of c is 4 then the discriminant becomes 0 indicating one real root. If we evaluate the quadratic equation when c = 4 we get x = -b/2a. This is the formula for determining the x coordinate of the vertex of a parabola. Substituting a = 1 and b=4 into the equation, x = -2. As we can see from our graph this is the point of intersection between the parabola and the line c=4, as well as, the vertex of the parabola. As there is only one vertex on a parabola, there must exist only one real root at this point.
![]()
Return to Janet Shiver's Home Page