Assignment 12
By: Sharren M. Thomas
The problem:
The following data
represents lumber output per tree (in 100s of board feet) based on the age of
the tree:
|
Age of Tree |
100s of Board Feet |
|
20 |
1 |
|
40 |
6 |
|
60 |
|
|
80 |
33 |
|
100 |
56 |
|
120 |
88 |
|
140 |
|
|
160 |
182 |
|
180 |
|
|
200 |
320 |
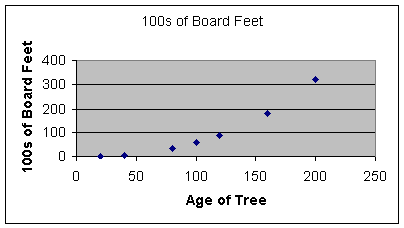
What function
will fit the data? Predict the harvest for ages other than those
given. See below the scatter plot for the given data.

I will try to approximate
this data. The shape of the graph looks as if it is a power function or
exponential curve.
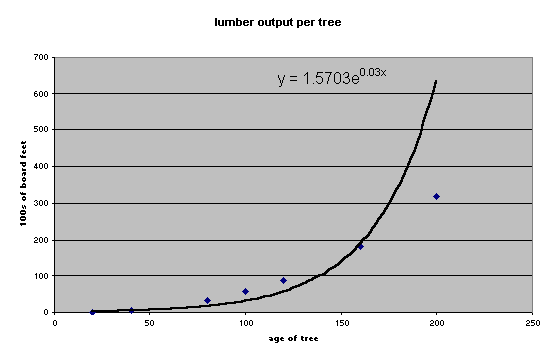
I will try to fit an
exponential curve to the data:

The residuals (difference
between observed and predicted values). The curve fits closely for the lower
numbers but as the age of the tree increases, the observed data does not
increase at such a high rate ( notice the outlier at age 200). The
residuals for this model:
|
Age of Tree |
100s of Board Feet |
Residuals |
|
20 |
1 |
-1.862 |
|
40 |
6 |
0.78509 |
|
60 |
|
|
|
80 |
33 |
15.682 |
|
100 |
56 |
24.44 |
|
120 |
88 |
30.488 |
|
140 |
|
|
|
160 |
182 |
-8.993 |
|
180 |
|
|
|
200 |
320 |
-314.3 |
There is a
large residual at age 200 which contributes strongly to an average sum of
squares of 14377.45776.
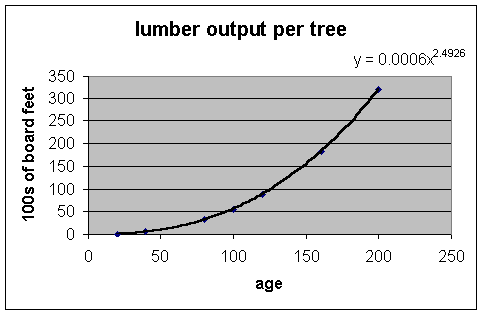
A power regression model
may be better:

This is the best model for
the data.
|
Age of Tree |
100s of Board Feet |
Residuals |
|
20 |
1 |
-0.026 |
|
40 |
6 |
0.22586 |
|
60 |
|
|
|
80 |
33 |
0.50342 |
|
100 |
56 |
-0.6756 |
|
120 |
88 |
-1.282 |
|
140 |
|
|
|
160 |
182 |
-0.889 |
|
180 |
|
|
|
200 |
320 |
1.0326 |
The mean sum
of squares is a very low 0.6088090794.
Being careful not to
extrapolate beyond our range of values we can now use the power model equation
y = 0.0006x^(2.4926)
to predict the lumber
harvest for trees that are 60, 140 and 180 years old. The lumber output
in 100s of board feet are 15.864, 131.11 and 245.296 respectively.