
Assignment 3
By: J. Matt Tumlin, Cara Haskins, & Robin Kirkham
Examine
Parabolas
We will start
with the quadratic equation, y = ax2 + bx + c.
Let us use Graphing Calculator 3.2 to examine the effects of using different values for a, b, and c.
Our first step
will be to look at the parabola
when a=1, c=1,
and varying the b.

We can discuss
the "movement" of a parabola as b is changed. The parabola
always passes through the same point on the y-axis (the point (0,1) with this
equation). For b<-2, the parabola will intersect the x-axis in two
points with positive x values (ie. the original equation will have two real
roots, both positive). For b=-2, the parabola will intersect the x-axis in one
point with a positive x value. For
b>2, the parabola will intersect the x-axis in two points with negative x
values. For b=2, the parabola will
intersect the x-axis in one point with a negative x value.
Let's first start by looking at different values of a. We will set b=1 and c=1 for y = ax2 + bx + c.
Now, we will
explore what happens when a = -3, -2, -1, 0, 1, 2, 3.
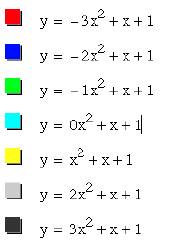
From the graph
above, we can see that the equation when a=0 is the tangent line to all of the
parabolas with a as a different values. We can also see that the line of
tangency will always cross the y-axis at c with a slope of b since the equation
of the line will be y = bx + c.
When b=1 and
c=1, our original equation will have two roots if a is negative. If a=0 our
original equation will have one root. For each negative a value there are 2
roots, one positive root and one negative root. Notice if we changed the value
of c then the a values that have roots would change. Now, it appears that our
original equation will not have roots for positive a, but take a look at the
next group of equations.
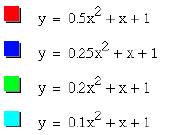
Here, we see
that the our equation becomes tangent to the x-axis at (-2, 0) giving us one
negative root for a=0.25 and two negative roots for 0<a<0.25.
Next, let's
explore b again. We will set a=1 and c=1.
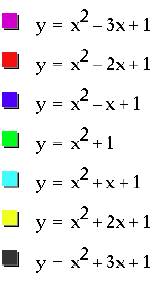
So, if we set
b = -3, -2,
-1, 0, 1, 2, 3, and overlay the graphs, the following picture is obtained.

Now, consider the
locus of the vertices of the set of parabolas graphed from y = ax2 +
bx + c.
The vertices
are as follows:
(1.5, -1.25)
for b=-3
(1, 0) for
b=-2
(0.5, 0.75)
for b=-1
(0, 1) for b=0
(-0.5, 0.75)
for b=1
(-1, 0) for
b=2
(-1.5, -1.25)
for b=3
As you can see
the locus of the vertices appears to be parabolic.
To find the
equation of the parabola we first go back to the original form of a parabola y = ax2 + bx +
c.
Now, we can
see that the parabola is concave down by looking at the vertices above. Thus,
our a will be -1 and we get y = -1x2 + bx + c.
We also see
that the roots of the parabola are 1 and -1 from the points (0,1) and (-1, 0).
We can use these roots to form the following equation in factored form, y= (x +
1)(x – 1).
Now, we see
that setting each factor equal to 0 will give us the roots 1 and -1. When
simplifying we get
y = -1x2
+ 1.
Therefore, the locus of
the vertices when a=1, c=1, is the parabola y= -1x2 + 1.