
Exploring Functions
Through Spreadsheets
By: Kimberly Young
I graphed the function 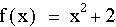 .
.
First, I began by creating a table of values using
a specific function that I chose, .
| x |
 |
| -10 |
102 |
| -9 |
83 |
| -8 |
66 |
| -7 |
51 |
| -6 |
38 |
| -5 |
27 |
| -4 |
18 |
| -3 |
11 |
| -2 |
6 |
| -1 |
3 |
| 0 |
2 |
| 1 |
3 |
| 2 |
6 |
| 3 |
11 |
| 4 |
18 |
| 5 |
27 |
| 6 |
38 |
| 7 |
51 |
| 8 |
66 |
| 9 |
83 |
| 10 |
102 |
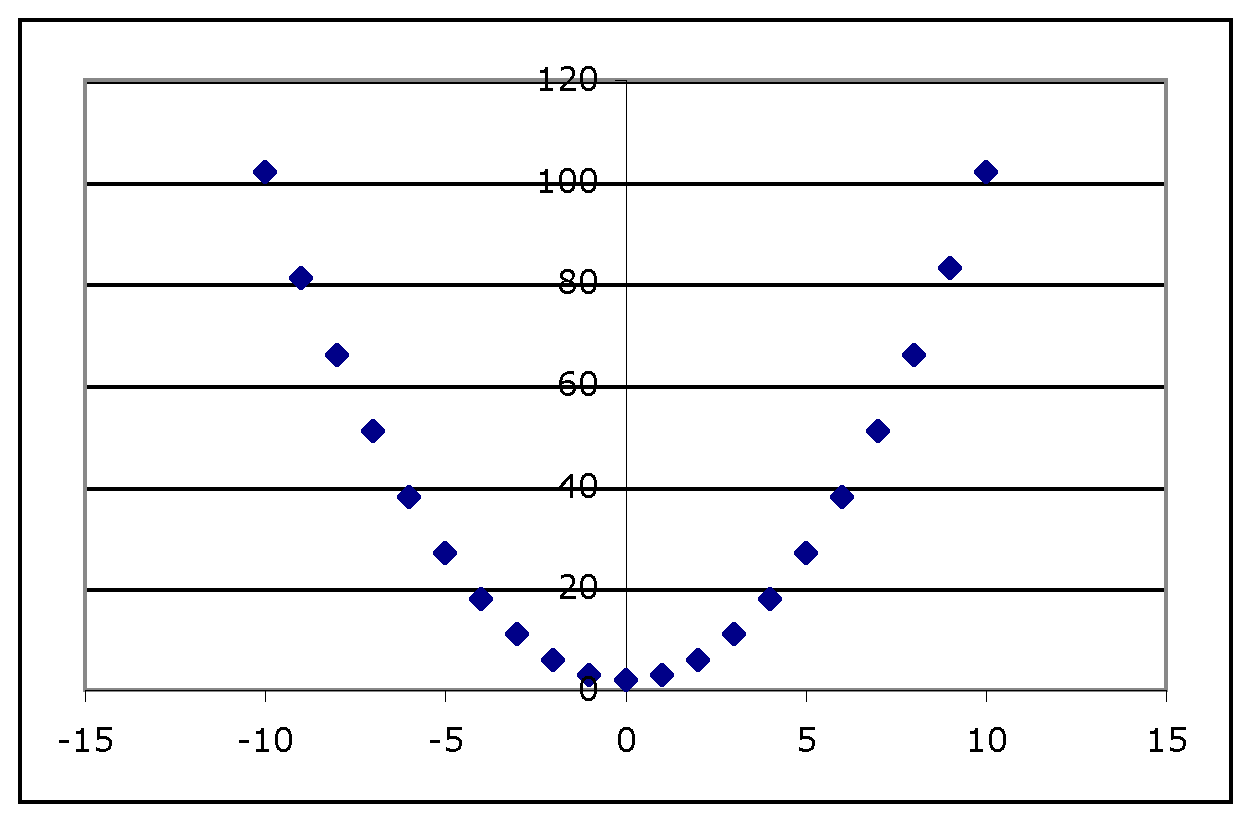
From the table, the follow graph was constructed using
Excel.
Click Here to view the
excel file.