Assignment 10
Page Bird
Parametric Curves
![]()
A parametric curve in
the plane is a pair of functions
![]()
where the two continuous functions
define ordered pairs (x,y). The two equations are usually called the parametric
equations of a curve. The extent of the curve will depend on the range of t and your work with parametric
equations should pay close attention the range of t . In many applications, we think
of x and y "varying with time t " or the angle of rotation
that some line makes from an initial location.
Various graphing technology, such as the TI-81, TI-82, TI-83, TI-85, TI-86,
TI-89, TI- 92, Ohio State Grapher, xFunction, Theorist, Graphing Calculator
3.2, and Derive, can be readily used with parametric equations. Try Graphing
Calculator 3.2 or
xFunction for
what is probably the friendliest software.
Note: Graphing technologies compute values of (x,y) for
increments of t and then construct a
line segment connecting them. When the increment of t is small then these are very short segments and the curve
is simulated. The TI instruments include a 'step' setting for the increments of
't' and it is possible for consecutive (x,y) to be rather far apart. This can produce
interesting drawings but misrepresent the parametric curve given by the set of
points. In other words, the 'step' setting is a way of drawing segments between
regularly spaced but not adjacent points on the parametric curve.
![]()
EXPLORATION 8
![]()
8. Investigate
![]()
for different values of a and b. What is the curve when a < b? a = b? a > b?
Let’s
start with Case 1: a<b
Let’s
first try a=1 and b=4
The graph is an ellipse and
its major axis is vertical.
You can
see that the vertices of the ellipse is (0, +4) and (0, -4).
Remember
that the standard equation for an ellipse whose major axis is vertical can be
found by:
The greater the eccentricity
of an ellipse, the more elongated the ellipse. Eccentricity (e) can be found by

Let’s
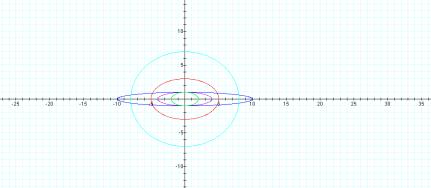
look at several different graphs with values of a and b such that a<b.
Can you
tell which equations go with which of the graphs? While you’re at it, note the eccentricity of each ellipse.

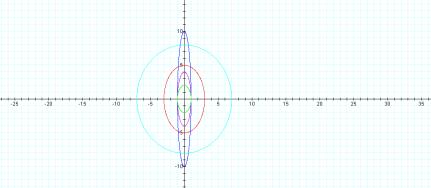
A =1, b =4
A=1, b=10
A=7, b=8
A=3, b=5
A=1, b=2
This
graph shows another important property of ellipses. The maximum and minimum x values can easily be seen along
the x-axis and is the same as the b values, given by (0, b) or (0, -b). So as b gets larger, the eccentricity
increases.
One last
observation regarding a<b. What if a and b are negative? Does the ellipse have the same
characteristics?
Let’s look at some more
graphs to see what happens.
a =-1, b =-4
a=-1, b=-10
a=-7, b=-8
a=-3, b=-5
a=-1, b=-2
The
eccentricity of the ellipses are much the same as before. However, the major axis is horizontal when the values of a and b are negative.
Notice when a=o and b=1. Our graph is a line and not an
ellipse:
Before concluding case 1 let’s first look at our
equations. We started out with:
![]()
We can rewrite this as
Now, if we square each side, we get:
When we add each side, we get
We know that
![]()
Therefore,
This is the standard form
for an ellipse.
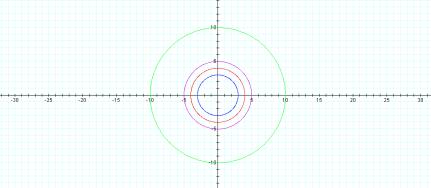
CASE 2:
a=b
Let’s start with some graphs
such that the values a=b.
a, b = -5
a, b = 10
a, b = 5
a, b = 1
a, b = -3
Notice
that each graph is a circle with the origin at (0,0) and with a radius equal to the absolute
value of a and
b. So why did I graph five equations, but
there are only four graphs showing?
The
answer is that a,b =5 and a,b =-5 graph to be the same.
Case 3:
a>b
Let’s
take a look using Graphing Calculator 3.2
a =10, b =5
a=2, b=1
a=5, b=2
When a>b it is easy to see that the ellipses’ major axis is
horizontal. The value for a determines the y maximum and minimum values.
What do you think will happen
if a and b are negative values?
Investigation 2
What is changed if the equations are
![]()
where h is any real number?
Investigate
with graphs for small h (e.g. -3 < h < 3).
To figure out what is going on, let’s look at some
graphs
using the equations above.
Let’s
first try h=-3,
let a=b
a, b = 10
a, b = 4
a, b = 5
a, b = 3
The
equations graphed here are:

As a=b gets larger so does the graph.
So, what
if we try h=-2 with
the same a=b
values above.
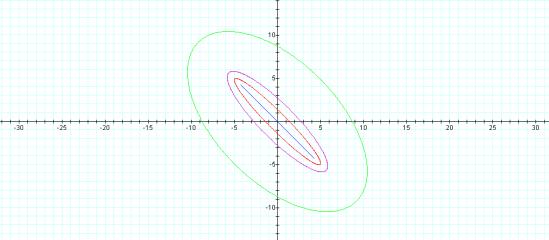
As h
increases, the
eccentricity decreases. Below are
the graphs for h=0.
Graphing h= 1, 2, 3 the eccentricity of the ellipse
corresponds with the eccentricity of h=-1, -2, and –3 respectively. However, it is a reflection of the
negative values.
Playing around with the
values of a, b, and h yields
different ellipses some with more or less eccentricity then above. Click here to
see a dynamic graph with different h values. You can
change the a and b values as well.
Click here
to return to my home page.