Assignment
3
Investigation
2
Page Bird
Graphs
in the xc plane.
Consider the equation
![]()
Consider the case when c = - 1 rather than + 1.

Below is the graph of several values of c.
These are the equations of those graphed above. The smaller the value of c, the less
curved the graph. Once c=0 the
graph becomes a straight line.
C=1,
2, 3, 4, 15
![]()
![]()
![]()
![]()
![]()
To see a dynamic graph of
different c values, click here.
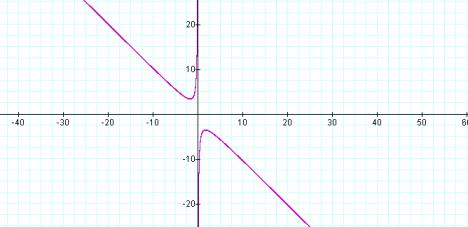
When c is positive the graph of the equation looks like the graph below which
is the graph of
![]()
When we consider graphing
2x+b=0 in the bx plane, we see that it has an interesting relationship with the
solutions in the xy-plane. That is
to say that 2x+b=0 intersects
![]()
where the solutions in the xy-plane are located.
For example, if you click here and go to the graph, you can note
that 2x+b=0 intersects
![]()
at two points. These two points are (0.697, -1.394) and
(4.302, -8.606).
Using the quadratic formula
to solve in the xy-plane we get,
X=
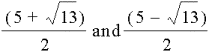
or
x = 4.303 and .697
The solutions for the
quadratic equations can easily be seen on the graph. When graphing
![]()
the solution is x=0.
However, when there are no
real solutions, the graph indicates that the solution is not satisfied in the
region shown. Click here to
compare the graph of an equation with no real solutions and one with two real
solutions.