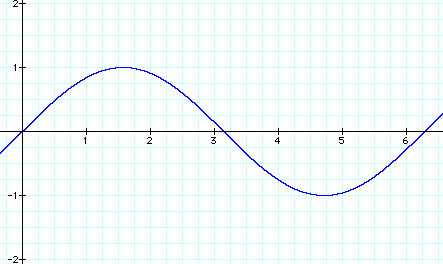

First, let's consider y = sin x, where a = 1, b = 1 and c = 0:

This graph represents the parent function whose maximum value is 1, minimum value is -1 and the period is 2p.
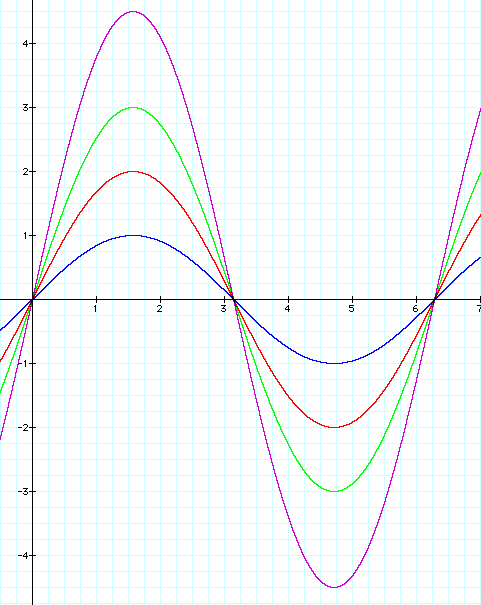
Consider the graph of y = a sin x for different values of a.
What is the effect of the value of a on the graph? Consider the following:

Notice that each of the graphs have the same x-intercepts and the same period; however, their respective distances from the x-axis (i.e., their maximums and minimums) are different. The absolute value of the a value represents the amplitude of the graph, which in turn describes the vertical stretch (a > 1) or compression (0 < a < 1). If the value of a is negative, the absolute value of a is the amplitude, but the graph is reflected over the x-axis:

Here the amplitude of the second graph is 2, but notice that instead the first peak is not at 2 as we would expect, but at -2.
Consider the graph of y = sin (bx) for different values of b.
As stated earlier, the period for the sine function is 2p. As we consider the following graphs, note what effect b has on the regular period.

The period for the new graphs is 2p/b. For 0 < b < 1, the graph is horizontally stretched, therefore the period (the time it takes for the function values to begin repeating) is increased: 2p/.5 = 4p. For b > 1, the graph is horizontally compressed, therefore the period is decreased: 2p/ 2 = p.
Now consider the graph of y = sin (x + c) for different values of c.

The value of c represents a horizontal translation of the graph, also called a phase shift. To determine the phase shift, consider the following: the function value is 0 at all x- intercepts of the graph, i.e. at all points x + c = 0. The phase shift is represented by x = -c. When c > 0, the graph shifts to the left c spaces, and if c < 0, the graph shifts to the right c spaces. For y = sin (x + p), the phase shift is -p. Notice that all points on the original graph are shifted to the left p spaces. The phase shift for y = sin (x - p/2) is p/2. All points on the original graph are shifted to the right p/2 spaces.
Now, let's determine the amplitude, period, and phase shift of the following graph:


The amplitude of the graph is 2.5. The period of the new function is 2p/3.
For the phase shift: 3x - p/2 = 0, x = p/6.
So where did the sine function and the other five trig functions originate? Click here to find out.