If we want to investigate polar equations we will begin by looking at the following equation.
![]() for
different values of a, b and k.
for
different values of a, b and k.
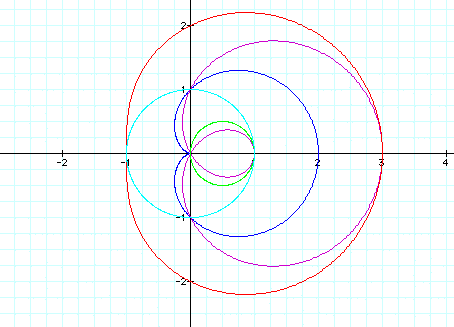
Here we have a=1, b=1 is the blue graph, a=1, b=2 is the purple graph, a=1, b=2 is the red graph, a=0, b=1 is the green graph, and a=1, b=0 is the light blue graph. We can also see the graph with different values of k.
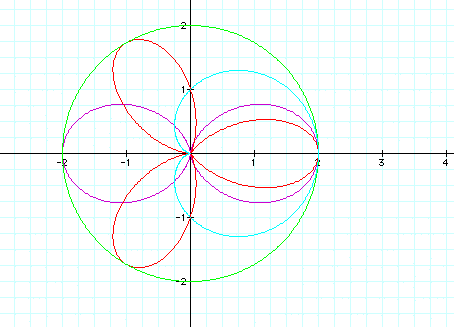
Click HERE to see the animation of the graph as k changes.
What if we replaced the cos() with sin().
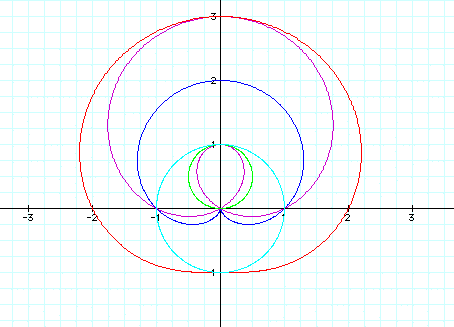
The graph simply rotates 90 degrees. Click HERE to see the animation of the graph of the new equation with different values of k.
Now we will look at some equations with different values of a, b, c, k and p.
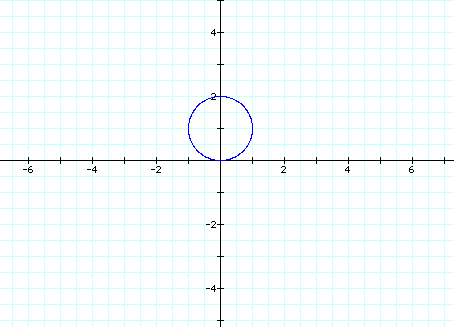
Click HERE to see the animation of the graph as a changes or HERE to see the graph as k changes.
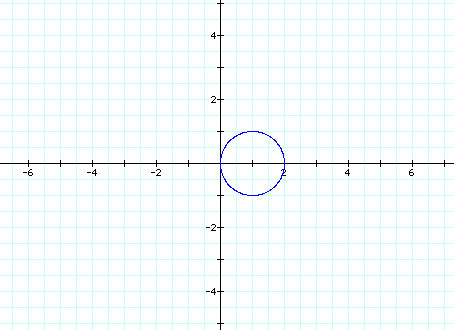
Click HERE to see the animation of the graph as a changes or HERE to see the graph as k changes.
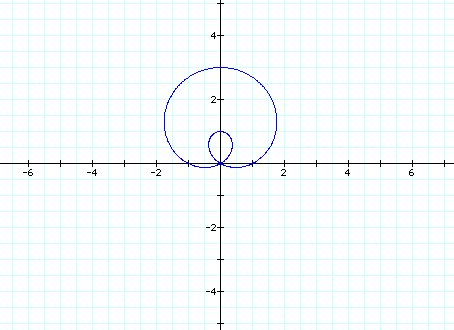
Click HERE to see the animation of the graph as a changes or HERE to see the graph as b changes, or HERE to see the animation of the graph as k changes.
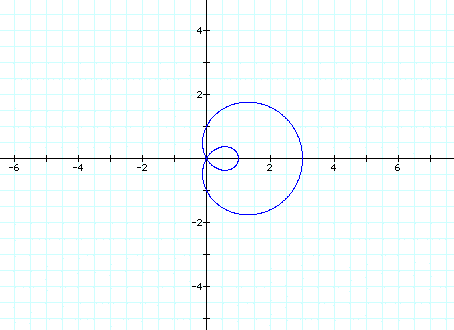
Click HERE to see the animation of the graph as a changes or HERE to see the graph as b changes, or HERE to see the animation of the graph as k changes.
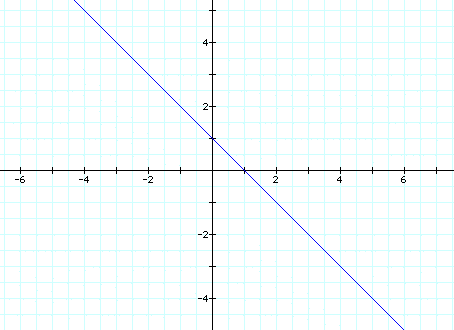
Click HERE to see the animation of the graph as a changes or HERE to see the graph as b changes, or HERE to see the animation of the graph as c changes or HERE to see the animation of the graph as k changes.
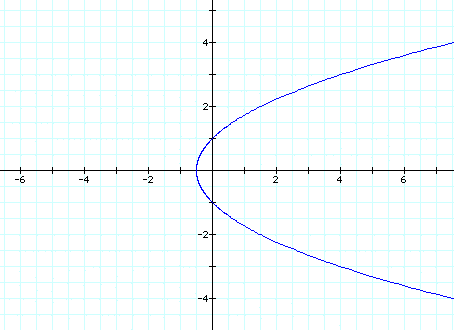
Click HERE to see the animation of the graph as p changes. Now lets look at the graph when k<1.
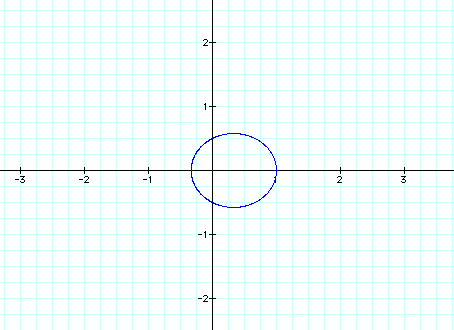
Click HERE to see the animation of the graph as p changes. Now lets look at the graph when k>1.
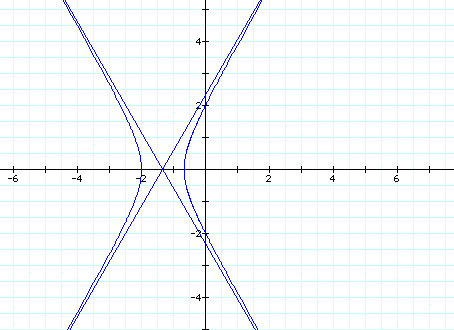
Click HERE to see the animation of the graph as p changes.
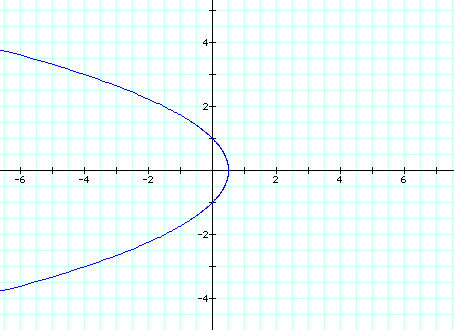
Click HERE to see the animation of the graph as p changes. Now lets look at the graph when k<1.
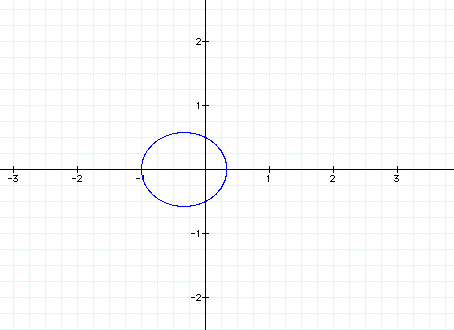
Click HERE to see the animation of the graph as p changes. Now lets look at the graph when k>1.
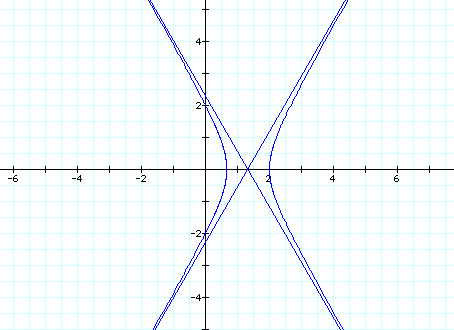
Click HERE to see the animation of the graph as p changes.
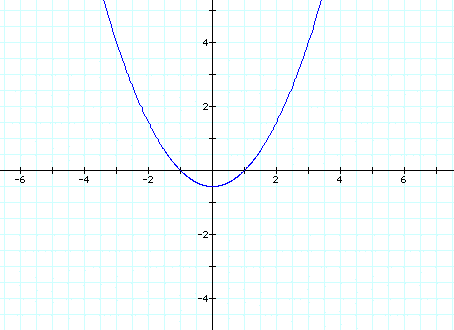
Click HERE to see the animation of the graph as p changes. Now lets look at the graph when k<1.
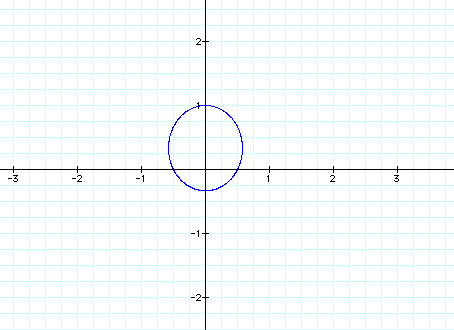
Click HERE to see the animation of the graph as p changes. Now lets look at the graph when k>1.
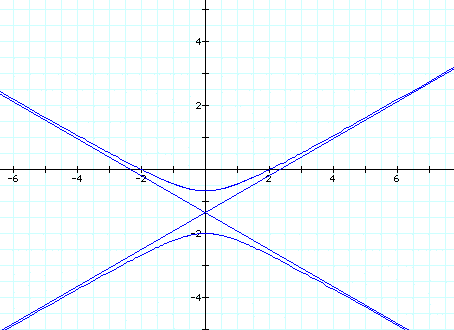
Click HERE to see the animation of the graph as p changes.
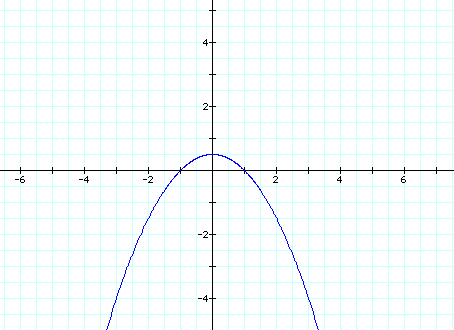
Click HERE to see the animation of the graph as p changes. Now lets look at the graph when k<1.
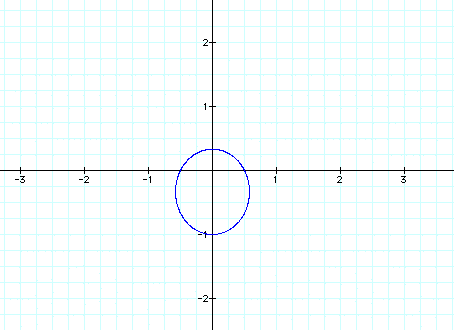
Click HERE to see the animation of the graph as p changes. Now lets look at the graph when k>1.
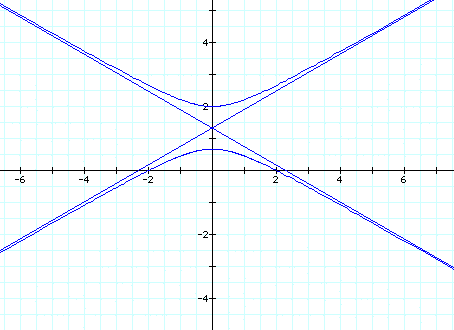
Click HERE to see the animation of the graph as p changes.
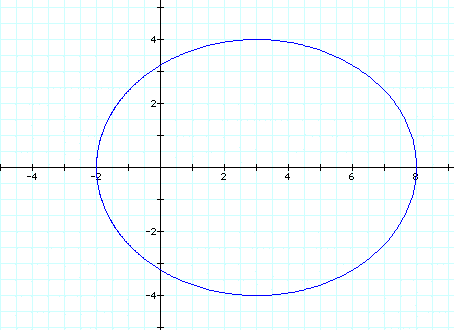
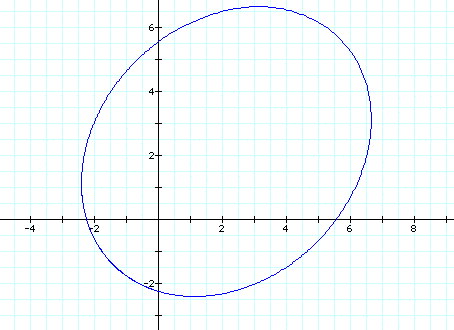
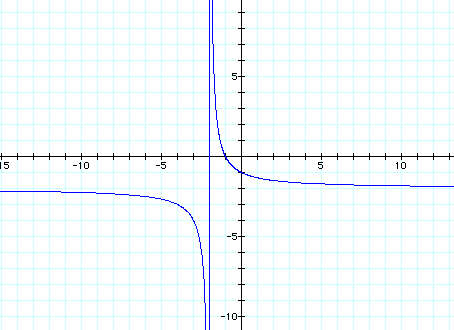
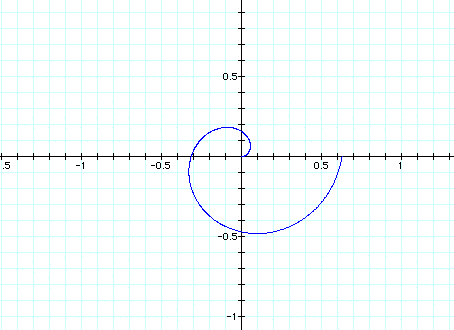
Now we will look at some equations with actual values instead of variables.
![]()

![]()
![]()


![]()


![]()

Click HERE to see the animation of the graph as a changes.


