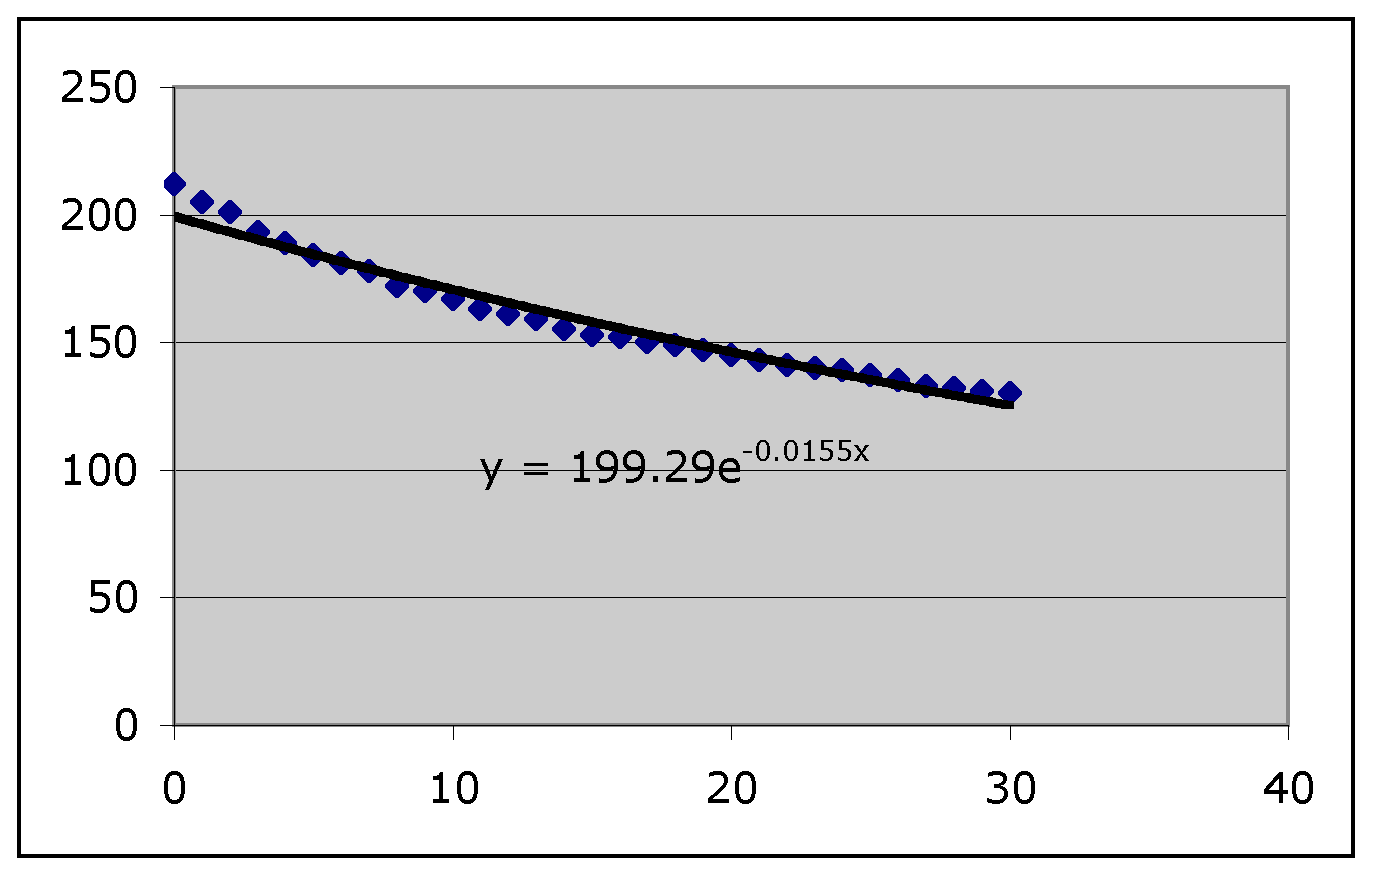
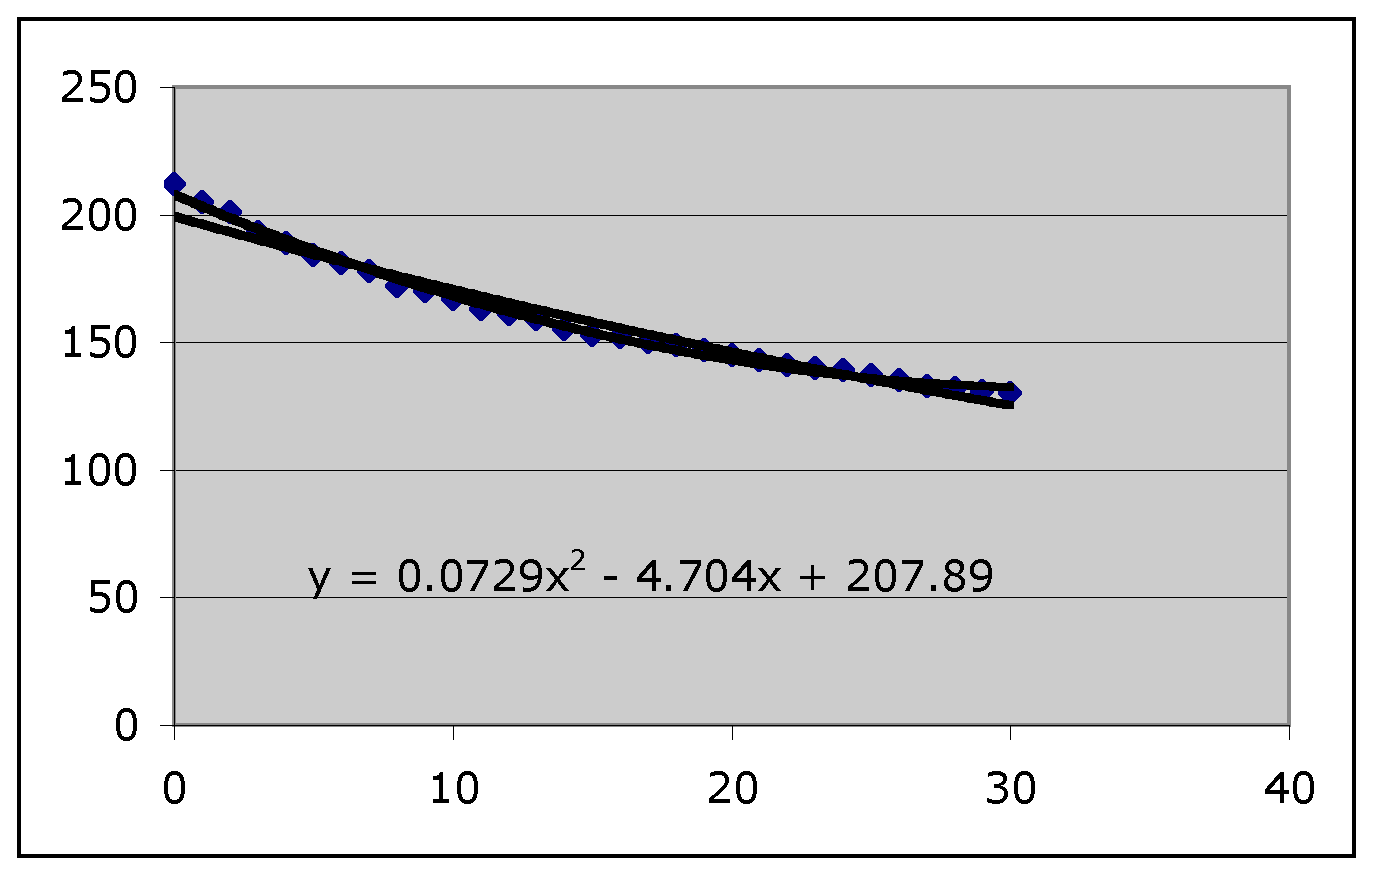
We have an experiment that was done with the following parameters.
Take a cup of hot water and measure its initial temperature (time = 0) and then record temperature readings each minute for 30 minutes. Make note of the room temperature.
Now we can make a spreadsheet with the data as follows.
| Time | Temperature |
| 0 | 212 |
| 1 | 205 |
| 2 | 201 |
| 3 | 193 |
| 4 | 189 |
| 5 | 184 |
| 6 | 181 |
| 7 | 178 |
| 8 | 172 |
| 9 | 170 |
| 10 | 167 |
| 11 | 163 |
| 12 | 161 |
| 13 | 159 |
| 14 | 155 |
| 15 | 153 |
| 16 | 152 |
| 17 | 150 |
| 18 | 149 |
| 19 | 147 |
| 20 | 145 |
| 21 | 143 |
| 22 | 141 |
| 23 | 140 |
| 24 | 139 |
| 25 | 137 |
| 26 | 135 |
| 27 | 133 |
| 28 | 132 |
| 29 | 131 |
| 30 | 130 |
| Time | Temperature | Predicted Value | Difference | Squared difference | Sum of squares | Error |
| 0 | 212 | 199.29 | -12.71 | 161.5441 | 555.738644157322 | 18.5246214719107 |
| 1 | 205 | 196.224821500553 | -8.77517849944715 | 77.0037576971595 | ||
| 2 | 201 | 193.206786958321 | -7.7932130416788 | 60.7341695129925 | ||
| 3 | 193 | 190.235171275989 | -2.76482872401061 | 7.64427787311415 | ||
| 4 | 189 | 187.309260508596 | -1.69073949140389 | 2.85860002779268 | ||
| 5 | 184 | 184.428351692006 | 0.428351692005748 | 0.183485172044187 | ||
| 6 | 181 | 181.591752674018 | 0.59175267401784 | 0.350171227207264 | ||
| 7 | 178 | 178.798781948074 | 0.798781948074151 | 0.638052600569135 | ||
| 8 | 172 | 176.048768489523 | 4.04876848952341 | 16.3925262817577 | ||
| 9 | 170 | 173.341051594405 | 3.34105159440458 | 11.1626257564734 | ||
| 10 | 167 | 170.674980720709 | 3.67498072070933 | 13.5054832975853 | ||
| 11 | 163 | 168.049915332086 | 5.04991533208636 | 25.5016448612409 | ||
| 12 | 161 | 165.465224743949 | 4.46522474394936 | 19.9382320139777 | ||
| 13 | 159 | 162.920287971952 | 3.92028797195206 | 15.368657783032 | ||
| 14 | 155 | 160.414493582794 | 5.41449358279374 | 29.3167407581146 | ||
| 15 | 153 | 157.947239547319 | 4.94723954731941 | 24.4751791385612 | ||
| 16 | 152 | 155.517933095879 | 3.51793309587944 | 12.3758532670839 | ||
| 17 | 150 | 153.125990575914 | 3.12599057591382 | 9.771817080702 | ||
| 18 | 149 | 150.770837311727 | 1.77083731172678 | 3.13586478460373 | ||
| 19 | 147 | 148.451907466418 | 1.45190746641819 | 2.10803529104089 | ||
| 20 | 145 | 146.168643905939 | 1.16864390593861 | 1.36572857888745 | ||
| 21 | 143 | 143.920498065235 | 0.920498065234966 | 0.847316688101316 | ||
| 22 | 141 | 141.706929816455 | 0.706929816455414 | 0.499749765393685 | ||
| 23 | 140 | 139.527407339181 | -0.472592660819259 | 0.223343823060228 | ||
| 24 | 139 | 137.381406992652 | -1.61859300734773 | 2.61984332343496 | ||
| 25 | 137 | 135.268413189964 | -1.73158681003562 | 2.99839288068934 | ||
| 26 | 135 | 133.187918274192 | -1.81208172580767 | 3.28364018100611 | ||
| 27 | 133 | 131.139422396425 | -1.86057760357463 | 3.4617490189235 | ||
| 28 | 132 | 129.122433395676 | -2.8775666043245 | 8.28038956232363 | ||
| 29 | 131 | 127.136466680634 | -3.86353331936647 | 14.9268897098549 | ||
| 30 | 130 | 125.181045113244 | -4.81895488675647 | 23.2223262005941 |
| Time | Temperature | Predicted Value | Difference | Squared difference | Sum of squares | Error |
| 0 | 212 | 207.89 | -4.11000000000001 | 16.8921000000001 | 94.1365955899999 | 3.13788651966666 |
| 1 | 205 | 203.2589 | -1.74110000000002 | 3.03142921000006 | ||
| 2 | 201 | 198.7736 | -2.22640000000001 | 4.95685696000005 | ||
| 3 | 193 | 194.4341 | 1.4341 | 2.05664281 | ||
| 4 | 189 | 190.2404 | 1.24039999999999 | 1.53859215999998 | ||
| 5 | 184 | 186.1925 | 2.1925 | 4.80705624999998 | ||
| 6 | 181 | 182.2904 | 1.29039999999998 | 1.66513215999994 | ||
| 7 | 178 | 178.5341 | 0.534099999999995 | 0.285262809999995 | ||
| 8 | 172 | 174.9236 | 2.92359999999999 | 8.54743695999996 | ||
| 9 | 170 | 171.4589 | 1.45889999999997 | 2.12838920999992 | ||
| 10 | 167 | 168.14 | 1.13999999999999 | 1.29959999999997 | ||
| 11 | 163 | 164.9669 | 1.96689999999998 | 3.86869560999993 | ||
| 12 | 161 | 161.9396 | 0.939599999999984 | 0.882848159999971 | ||
| 13 | 159 | 159.0581 | 0.058099999999996 | 0.00337560999999954 | ||
| 14 | 155 | 156.3224 | 1.32239999999999 | 1.74874175999997 | ||
| 15 | 153 | 153.7325 | 0.732499999999987 | 0.536556249999982 | ||
| 16 | 152 | 151.2884 | -0.711600000000004 | 0.506374560000006 | ||
| 17 | 150 | 148.9901 | -1.00990000000002 | 1.01989801000003 | ||
| 18 | 149 | 146.8376 | -2.16239999999999 | 4.67597375999996 | ||
| 19 | 147 | 144.8309 | -2.16910000000001 | 4.70499481000006 | ||
| 20 | 145 | 142.97 | -2.03 | 4.1209 | ||
| 21 | 143 | 141.2549 | -1.74510000000001 | 3.04537401000003 | ||
| 22 | 141 | 139.6856 | -1.31440000000001 | 1.72764736000002 | ||
| 23 | 140 | 138.2621 | -1.7379 | 3.02029640999999 | ||
| 24 | 139 | 136.9844 | -2.01560000000001 | 4.06264336000002 | ||
| 25 | 137 | 135.8525 | -1.14750000000001 | 1.31675625000002 | ||
| 26 | 135 | 134.8664 | -0.133600000000001 | 0.0178489600000003 | ||
| 27 | 133 | 134.0261 | 1.02609999999999 | 1.05288120999997 | ||
| 28 | 132 | 133.3316 | 1.33160000000001 | 1.77315856000002 | ||
| 29 | 131 | 132.7829 | 1.78289999999998 | 3.17873240999994 | ||
| 30 | 130 | 132.38 | 2.38 | 5.66439999999998 |