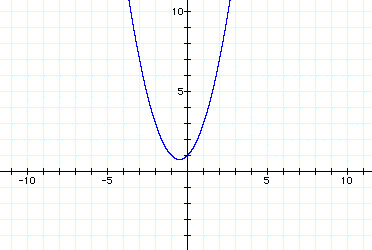
As we look at the graph of ![]() we notice it is a parabola when a=b=c=1.
we notice it is a parabola when a=b=c=1.

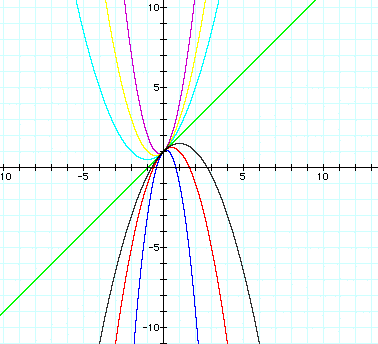
We can see by fixing two values at a time what happens as the third value changes. The graphs below show a=(-2) in blue, a=(-1) in red, a=(0) in green, a=(1) in yellow, a=(2) in purple, a=(0.5) in light blue, and a=(-0.5) in grey, all with b and c fixed as b=c=1. Click HERE to see the animation of a changing with fixed b and c.

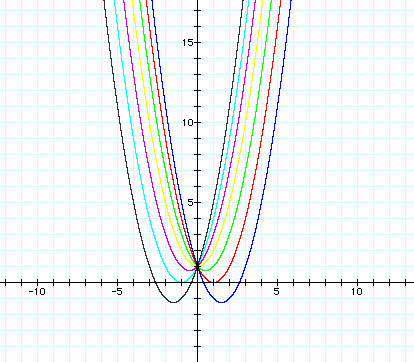
Now we can explore what happens to b as a and c are kept constant. The graphs below show b=(-3) in blue, b=(-3) in red, b=(-1) in green, b=(0) in yellow, b=(1) in purple, b=(2) in light blue, and b=(3) in grey, all with a and c fixed as a=c=1. Click HERE to see the animation of b changing with fixed a and c.

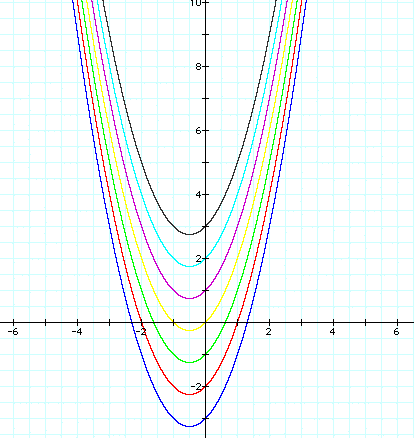
Lastly we can see what happens to c as a and b are kept constant. The graphs below show c=(-3) in blue, c=(-3) in red, c=(-1) in green, c=(0) in yellow, c=(1) in purple, c=(2) in light blue, and c=(3) in grey, all with a and b fixed as a=b=1. Click HERE to see the animation of c changing with fixed a and b.
