We will first begin by looking
at the equation ![]() . We can look at
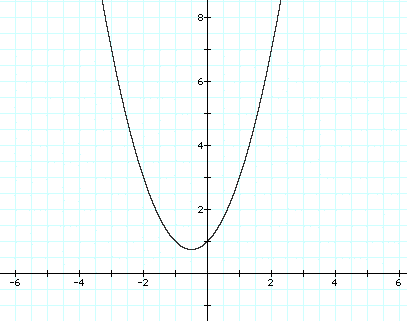
the graph below of
. We can look at
the graph below of ![]() . And we can also
hold one variable constant and see how the graph
varies as we change the others.
. And we can also
hold one variable constant and see how the graph
varies as we change the others.

We can use the graphs to determine
the roots of the equation ![]() , as
two of the variables are held constant. For example in the graph
below we will hold a and c constant at a=c=1 and graph several
values of b. The purple graph shows b=(-3), the red graph shows
b=(-2), the blue graph shows b=(-1), the green graph shows b=0,
the light blue graph shows b=1, the yellow graph shows b=2, and
the grey graph shows b=3.
, as
two of the variables are held constant. For example in the graph
below we will hold a and c constant at a=c=1 and graph several
values of b. The purple graph shows b=(-3), the red graph shows
b=(-2), the blue graph shows b=(-1), the green graph shows b=0,
the light blue graph shows b=1, the yellow graph shows b=2, and
the grey graph shows b=3.

We can discuss the "movement" of a parabola as b is changed. The parabola always passes through the same point on the y-axis ( the point (0,1) with this equation). For b < -2 the parabola will intersect the x-axis in two points with positive x values (i.e. the original equation will have two real roots, both positive). For b = -2, the parabola is tangent to the x-axis and so the original equation has one real and positive root at the point of tangency. For -2 < b < 2, the parabola does not intersect the x-axis -- the original equation has no real roots. Similarly for b = 2 the parabola is tangent to the x-axis (one real negative root) and for b > 2, the parabola intersects the x-axis twice to show two negative real roots for each b.
We can also look at the vertices
of the above graphs, and notice that the graph of ![]() goes through all of the vertices.
goes through all of the vertices.

We know this is true because
![]() is the locus of the equation
is the locus of the equation ![]() when a=c=1. We can see by the algebra
steps why this is true.
when a=c=1. We can see by the algebra
steps why this is true.