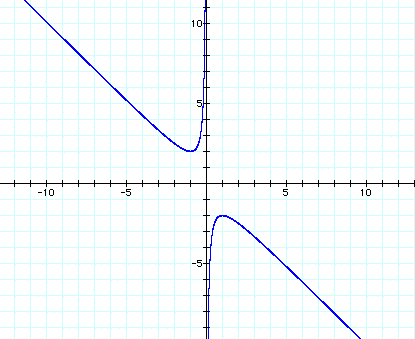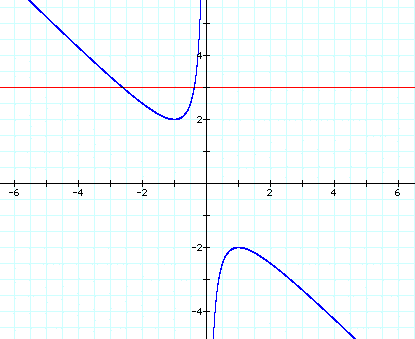
If we take any particular value of b, say b = 3, and overlay this equation on the graph we add a line parallel to the x-axis. If it intersects the curve in the xb plane the intersection points correspond to the roots of the original equation for that value of b. We have the following graph

For each value of b we select, we get a horizontal line. It is clear on a single graph that we get two negative real roots of the original equation when b > 2, one negative real root when b = 2, no real roots for -2 < b < 2, One positive real root when b = -2, and two positive real roots when b < -2.
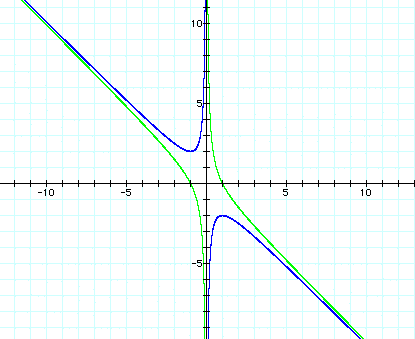
What would happen if we let c=-1 instead of c=1. We would get the following graph

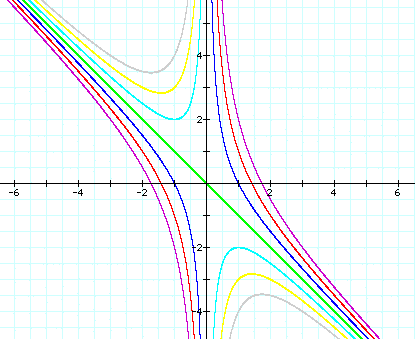
If we keep a and b constant the graph changes a great deal as we change c. We can see in the graph below a few different values of c. The purple graph shows c=(-3), the red graph shows c=(-2), the blue graph shows c=(-1), the green graph shows c=0, the light blue graph shows b=1, the yellow graph shows c=2, and the grey graph shows c=3.

Or you can click HERE
to see the animation of the graph as c changes.
Return to Assignment 3