
Assignment 12
The Spreadsheet in Mathematics Explorations
by Jeff Hall
Problem 1
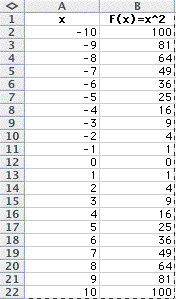
Construct a graph of any function y=f(x)
by generating a table of values with
the x values in one column and the
y values in another.
For my equation, I chose f(x)=x^2,
with values of x from -10 to 10.
Here is my spreadsheet:
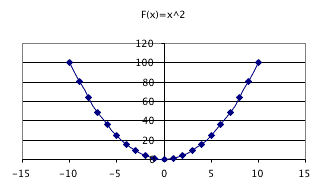
 And the graph:
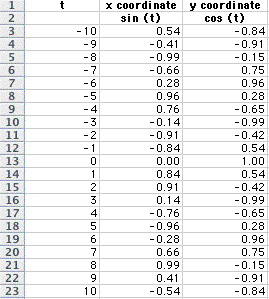
Problem
2
Here is the spreadsheet of my parametric
equation:
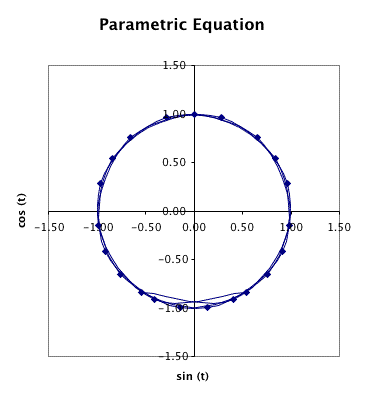
 And here is my graph:
Problem 4
Generate a Fibonacci sequence using
a spreadsheet.
Problem 4a
Here is my spreadsheet of the Fibonacci
sequence, from n=1 to 25.
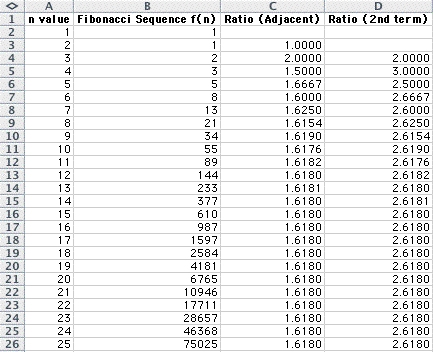 Column C shows the adjacent ratio between
consecutive Fibonacci numbers.
Column D shows the ratio between every
second Fibonacci numbers.
Notice that the ratio becomes constant
as n increases for both ratios, albeit at a difference of 1.
Problem 4b
Construct a Lucas Sequence, where f(1)=1
and f(2)=3
Here is the spreadsheet of the sequence:
Column C shows the adjacent ratio between
consecutive Fibonacci numbers.
Column D shows the ratio between every
second Fibonacci numbers.
Notice that the ratio becomes constant
as n increases for both ratios, albeit at a difference of 1.
Problem 4b
Construct a Lucas Sequence, where f(1)=1
and f(2)=3
Here is the spreadsheet of the sequence:
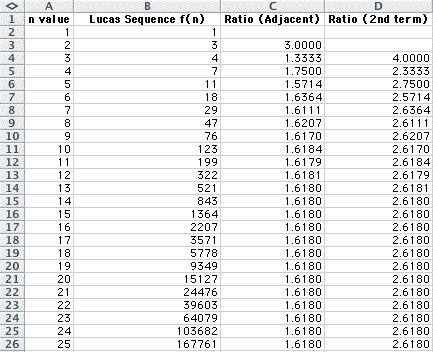 Notice that both ratios reach the same
limit as the original Fibonacci sequence.
Notice that both ratios reach the same
limit as the original Fibonacci sequence.
Problem 5
Explore problems of growth, such as
those involving savings with interest compounded.
The concept of Time Value of Money
(TVM) is used as a reason for people to invest and save
money at the earliest possible age.
The concept is relatively simple: Money in an interest-bearing
account
will grow exponentially in comparison
to the principal invested over time. The more time you keep
money invested, the greater the potential
for growth.
Let's use a spreadsheet to illustrate
this idea. Suppose you invested $1,000 in a savings account
earning 3% a year on your 30th birthday.
If you never add or take money from the account, how
much money would you have when you
turn 65 years old?
Here is my spreadsheet:
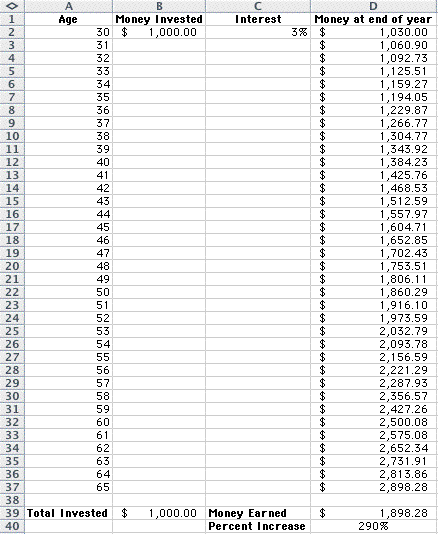 The initial investment of $1,000 has
grown to $2,899 dollars.
This is an increase of 290% from an
account growing only 3% a year!
Imagine if you invested in a mutual
fund earning an average of 10% a year. You also
increased your investment amount to
$1,000 a year for 10 years, until your 40th birthday.
How much money would you have at age
65?
Here is the spreadsheet:
The initial investment of $1,000 has
grown to $2,899 dollars.
This is an increase of 290% from an
account growing only 3% a year!
Imagine if you invested in a mutual
fund earning an average of 10% a year. You also
increased your investment amount to
$1,000 a year for 10 years, until your 40th birthday.
How much money would you have at age
65?
Here is the spreadsheet:
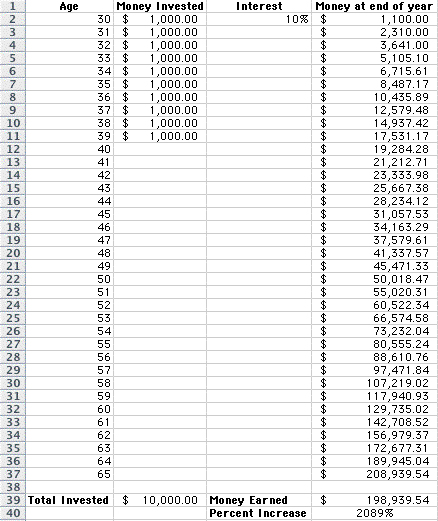 Wow! Your $10,000 investment grew 2089%,
earning you almost $200,000.
To see how powerful compounding interest
is, imagine that you didn't begin investing until age 40.
To catch up, you decide to invest $2,000
a year until you reach the age of 65.
Here's the graph:
Wow! Your $10,000 investment grew 2089%,
earning you almost $200,000.
To see how powerful compounding interest
is, imagine that you didn't begin investing until age 40.
To catch up, you decide to invest $2,000
a year until you reach the age of 65.
Here's the graph:
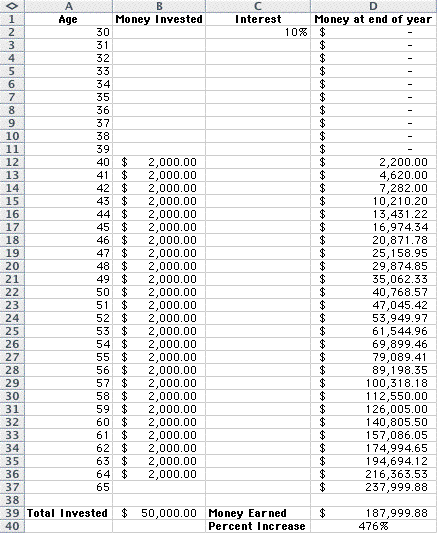 Amazing. Even after investing $50,000,
or 5 times as much, you earned less than $190,000.
That is still a great return, but it
illustrates nicely the power of compounding interest or TVM.
Amazing. Even after investing $50,000,
or 5 times as much, you earned less than $190,000.
That is still a great return, but it
illustrates nicely the power of compounding interest or TVM.
Problem
6
Explore problems of maximization such
as the lidless box formed from a 5x8 sheet
with a square removed from each corner.
Spreadsheets make it easy to try a
lot of different options.
In my spreadsheet below, I constructed
equations based on the variable of the cut square.
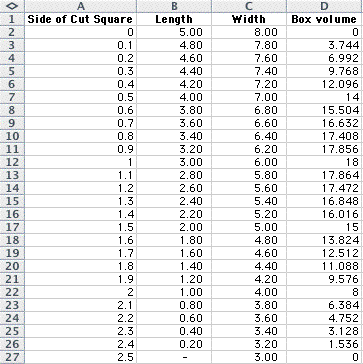 In column A, I input a full range of
possible cut squares, from sides equalling zero
to sides equalling 2.5, which would
wipe out the entire length of the sheet since
two squares are cut from each side
of the original 5x8 sheet.
I then subtracted twice the amount
of the square from both the length and width.
Finally, I calculated the volume of
the box as Length x Width x Height (Side of Cut Square).
As you can see, the maximum value occurs
when the Height equals 1.
In column A, I input a full range of
possible cut squares, from sides equalling zero
to sides equalling 2.5, which would
wipe out the entire length of the sheet since
two squares are cut from each side
of the original 5x8 sheet.
I then subtracted twice the amount
of the square from both the length and width.
Finally, I calculated the volume of
the box as Length x Width x Height (Side of Cut Square).
As you can see, the maximum value occurs
when the Height equals 1.
Problem 7
Place four numbers in the first row
as follows:
A B C D
For each successive row replace the
entries by the absolute value of the difference of the entry
just above and the entry just to the
right in the previous row. In the fourth position
use the absolute value of the difference
of the fourth and first (i.e. cycle)
|A-B| |B-C| |C-D| |D-A|
Will the process lead to 0 in all entries
for some row?
Here is my spreadsheet with the numbers
2, 5, 17, and 33:
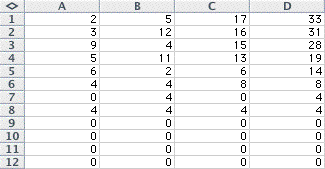 The process lead to a 0 in all entries
by the 9th row.
What is the largest number of rows
before a zero row is generated?
The most I was able to get was 11 rows
The process lead to a 0 in all entries
by the 9th row.
What is the largest number of rows
before a zero row is generated?
The most I was able to get was 11 rows
Problem 8
Use the following exploration to generate a
function to predict observed data.
a.Take a cup of hot water and measure its initial
temperature (time = 0) and then record temperature readings each
minute for 30 minutes. Make note of the room temperature . . .
b. Enter the data on a spread sheet and construct
a function that will model the data.
c. Using the function predict the temperature
after 45 minutes, 60 minutes, or 300 minutes.
d. Calculate a measure of the error
between your model and the observed data by taking the square
of the difference for each time, sum the squares, and divide by
the number of data points. You can use this statistic to guide
refinement of your function to model the data.
Here is my spreadsheet:
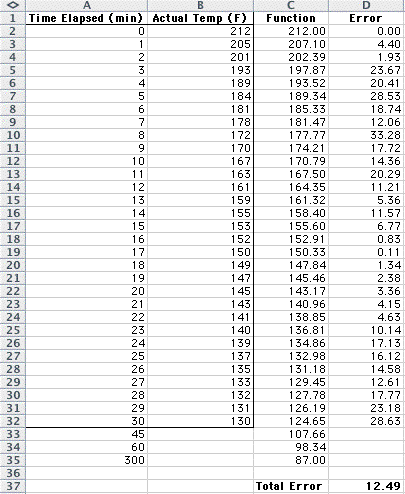 The boxed-in portion was given in the
problem. The function column
was created by me using the equation
y=140e^(-.033*A2)+72.
Notice that this function incorporates
the correct time for each row.
Rows 33-35 show the estimated temperature
after 45, 60, and 300 minutes, respectively.
The function I created in column C
shows the estimates. Notice that the temperature
reaches room temperature after 300
minutes, something we would expect from a good function.
Finally, cell D37 shows the Error of
my function. 12.49 is decent.
Here is the graph of the actual temperature
and the temperature generated by my function:
The boxed-in portion was given in the
problem. The function column
was created by me using the equation
y=140e^(-.033*A2)+72.
Notice that this function incorporates
the correct time for each row.
Rows 33-35 show the estimated temperature
after 45, 60, and 300 minutes, respectively.
The function I created in column C
shows the estimates. Notice that the temperature
reaches room temperature after 300
minutes, something we would expect from a good function.
Finally, cell D37 shows the Error of
my function. 12.49 is decent.
Here is the graph of the actual temperature
and the temperature generated by my function:
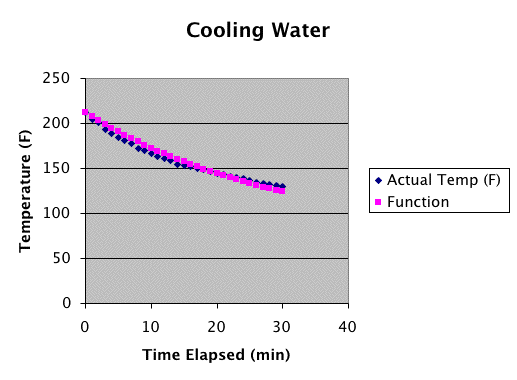 Notice that my purple function line
is close to the blue actual line.
Notice that my purple function line
is close to the blue actual line.
Return