Teaching Notes:
In this lesson, students look at the graph of a parabola. Students are probably most familiar with looking at a parabola in this way. Discussed in this lesson are parameter changes on the parabola's standard polynomial form: y = ax2 + bx + c. Graphing Calculator software will be used to help students visualize the parameter changes. A very helpful aspect of Graphing Calculator is the "n animation" feature. Substituting "n" for one of the parameters to be changed and then selecting a range of values for it, students can very easily see the effect of changing the variable. Students should graph each of the given equations along with y = x2 and determine the effect of each of the parameters on the graph of a parabola.
Introduction:
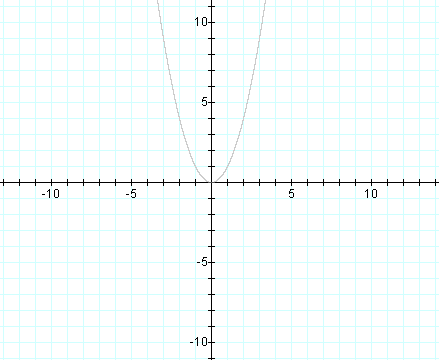
We'll begin by graphing y = x2 as a reference. In all future graphs, this graph will be provided in gray.
Graph: y = x2

Changing "a":
Now we will change the "a" parameter. We will look at graphs of y = ax2.
Graph: y = 2x2 and y = x2
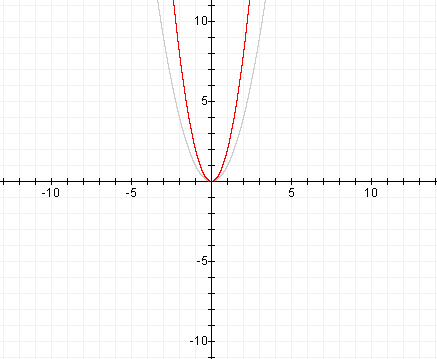
Graph: y = 5x2 and y = x2
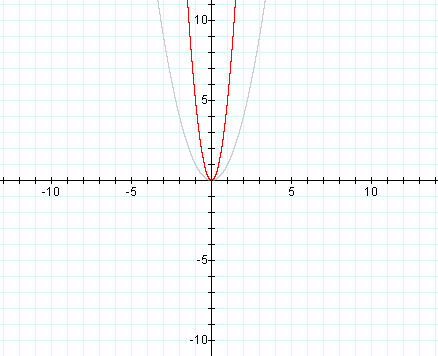
Increasing the value of "a" greater than 1 seems to narrow the graph.
Graph: y = (1/2)x2 and y = x2
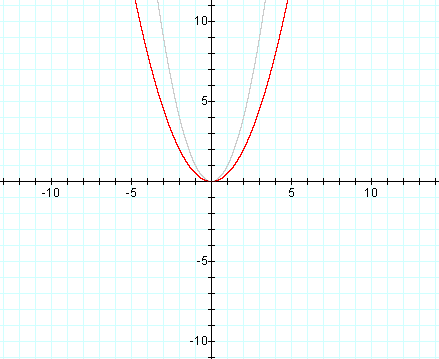
Graph: y = (1/5)x2 and y = x2
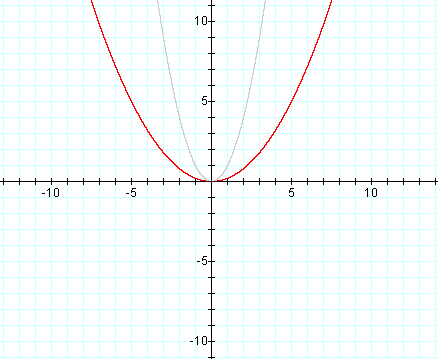
Decreasing the value of "a" less than 1 but greater than zero seems to widen the graph.
Graph: y = -x2 and y = x2
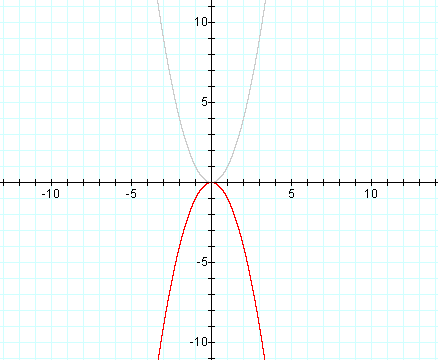
Graph: y = -(1/5)x2 and y = x2
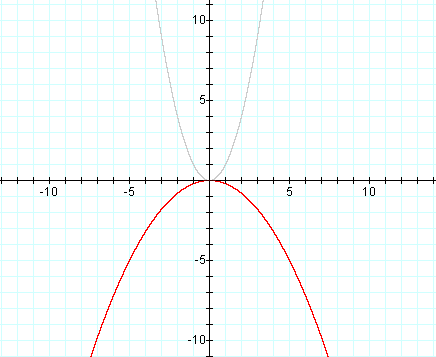
Graph: y = -2x2 and y = x2
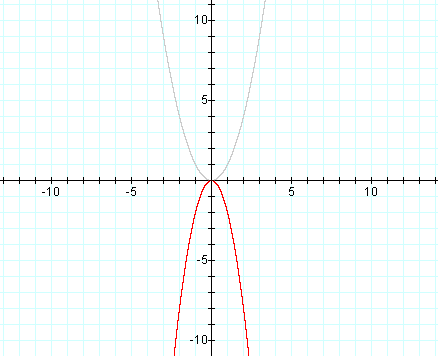
Negative values of "a" behave in the same manner, but are reflected across the x axis.
Summary:
In general, negating the value of "a" will reflect the existing graph across the x axis. As
"a" increases (positive values) or decreases (negative values) from zero, the parabola will
narrow.
Changing "b":
Now we will change the "b" parameter. We will look at graphs of y = x2 + bx.
Additional Teaching Notes:
Students often have difficulty seeing the effect of the "b" parameter. In this case, Graphing
Calculator's n-animation feature will be very helpful. Students should set up the equation
y = x2 + nx and then set a range for n using a sufficient number of steps. Two animations
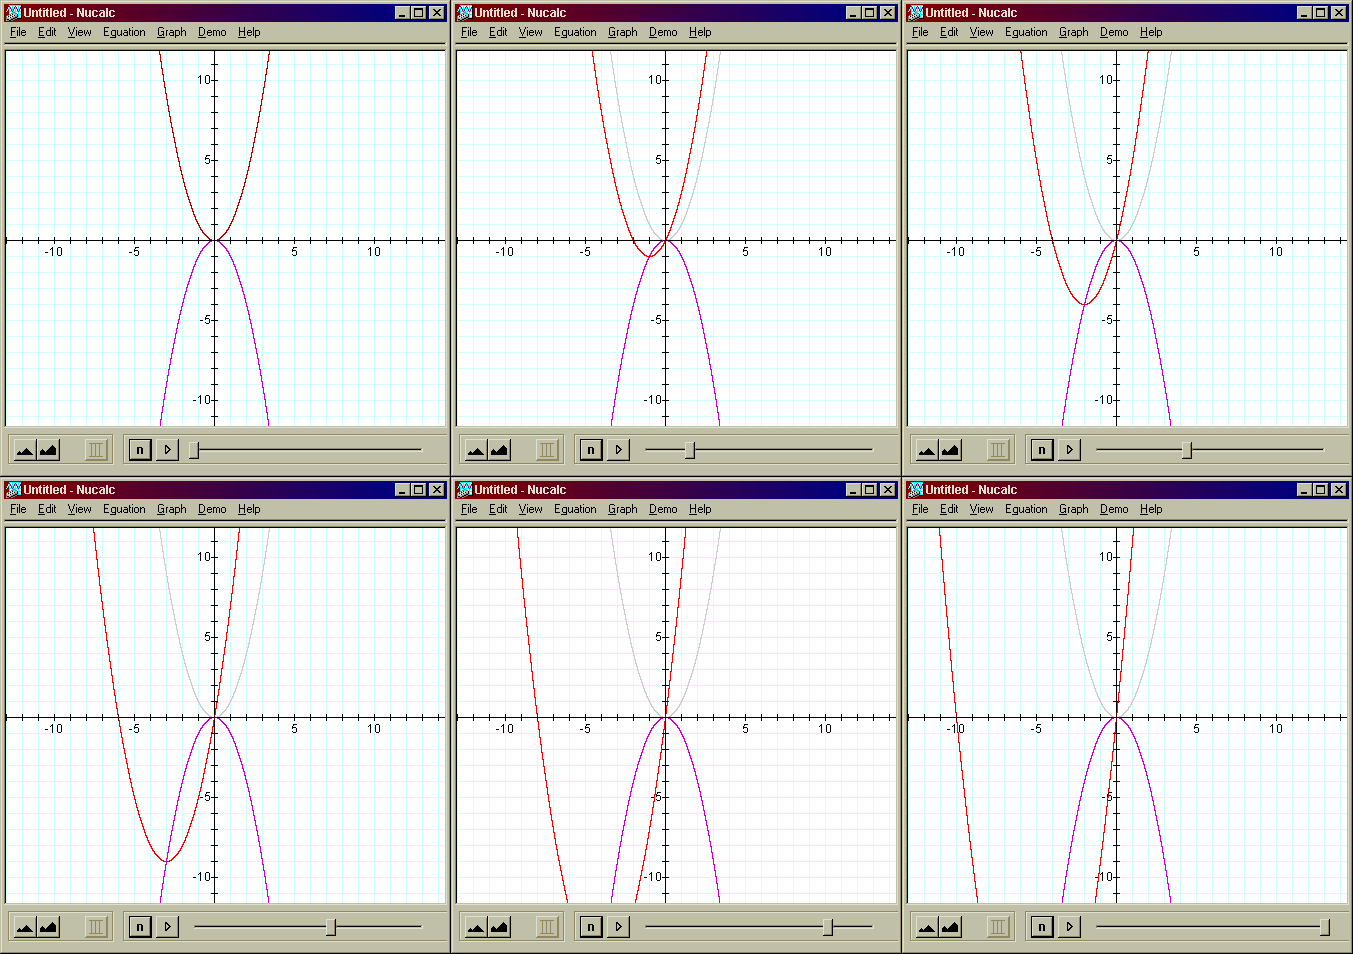
are provided here as an example. Emphasized on these animations is the path which the vertex of the
animated parabola follows.
Graph: y = x2 + nx (red / n varies from 0 to -10) and y = -x2 (purple) and y = x2
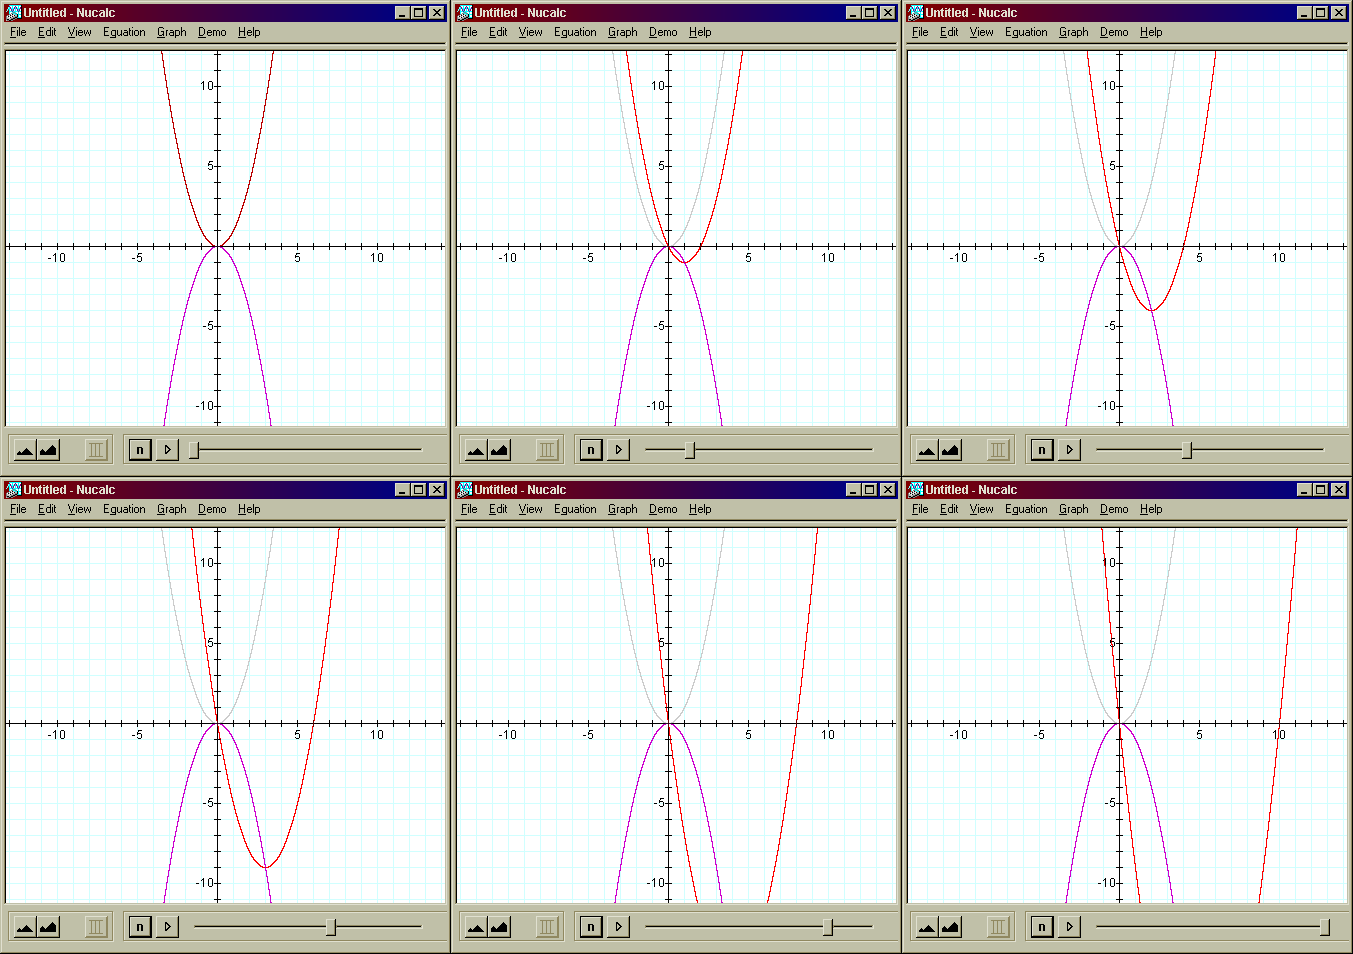
Graph: y = x2 + nx (red / n varies from 0 to 10) and y = -x2 (purple) and y = x2
Summary:
In general, changing the value of "b" causes a translation along a parabolic path. The vertex
translates along a parabolic path which is the original graph's reflection across the x axis.
Additional Teaching Notes:
Students may have difficulty visualizing the "parabolic path" along which the parabola translates. Most
students will probably say that it translates diagonally. Some teacher assistance may be required in order for
students to find the correct path.
Changing "c":
Now we will change the "c" parameter. We will look at graphs of y = x2 + c.
Graph: y = x2 + 3 and y = x2
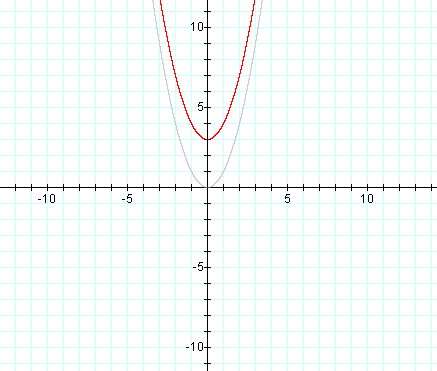
Graph: y = x2 - 4 and y = x2
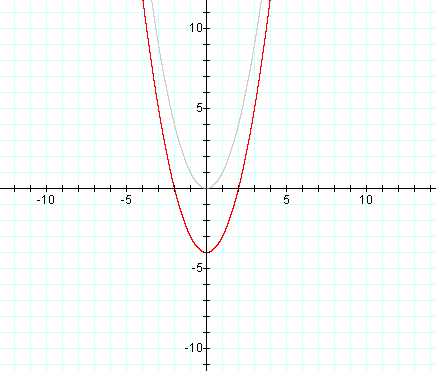
Summary:
In general, changing the value of "c" causes a vertical translation. As "c" increases,
the parabola translates up. As "c" decreases, the parabola translates down.
Interaction of the Parameters:
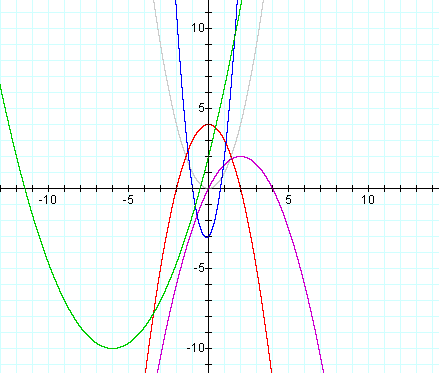
Of course, all of these parameters can change at the same time, resulting in narrowing, widening, and numerous translations. Students should graph some parabolas which have different values for a, b, and c. Then they should attempt to visualize each of the parameter changes that they now know the effects of.
Homework Problems:
Graph the following parabolas:
Homework Solutions:
