Teaching Notes:
In this lesson, students will extend their use of Graphing Calculator to cubic and quartic functions. The main goal of this lesson is to introduce students to the general shape of cubic and quartic graphs. More advanced students may make the conjecture about the number of "humps" (maxima or minima) on the graph and the degree of the function. If this conjecture is made, the instructor should encourage the students to check their conjecture.
Introduction:
For this lesson, students should graph numerous cubics (y = ax3 + bx2 + cx + d) and quartics (y = ax4 + bx3 + cx2 + dx + e) to allow them to get a general idea of the shapes of these graphs. Some possible equations to graph are given.
Cubics:
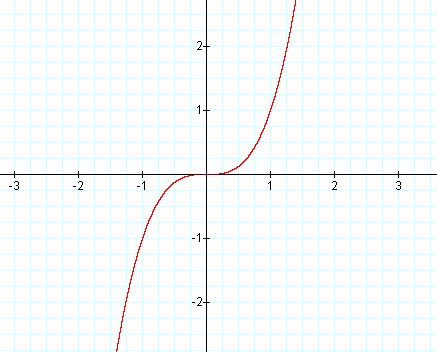
Graph: y = x3

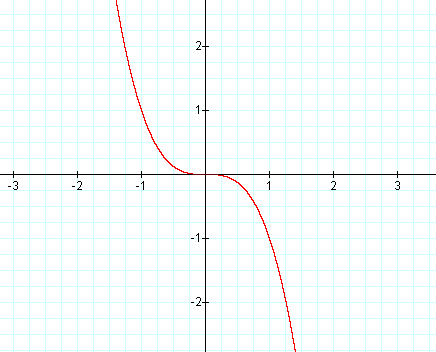
Graph: y = -x3
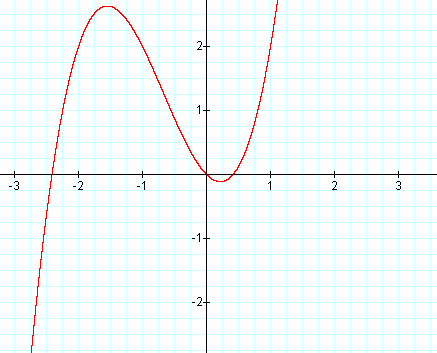
Graph: y = x3 + 2x2 - x
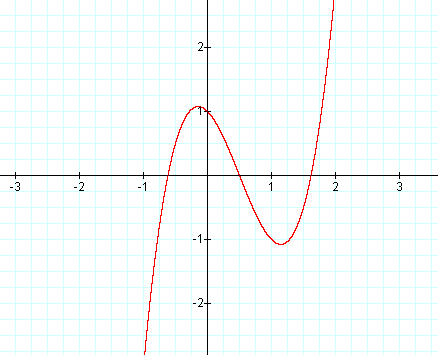
Graph: y = 2x3 - 3x2 - x + 1
Quartics:
Graph: y = x4
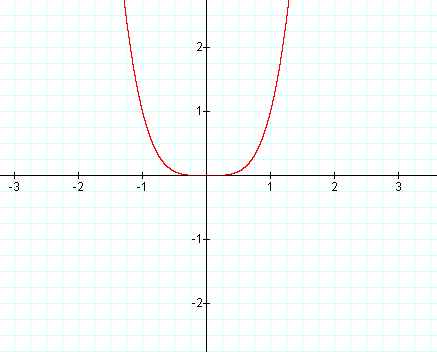
Graph: y = -x4
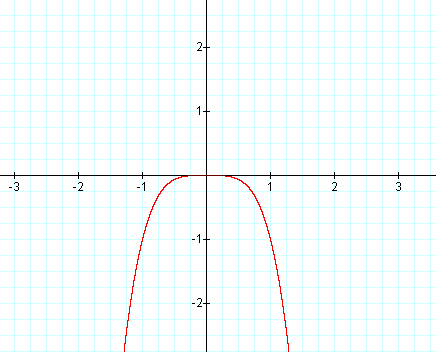
Graph: y = x4 + x3 - 2x2
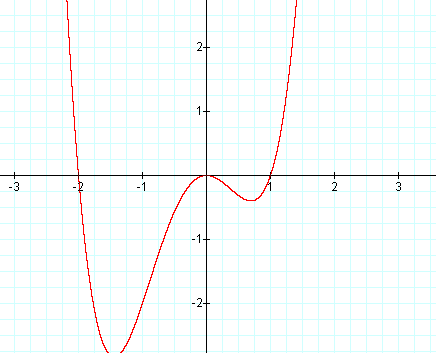
Graph: y = x4 + x3 - 5x2 - x + 1
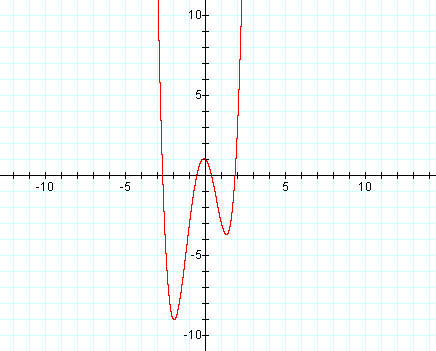
Wrap-Up:
At this point, students should be able to classify a graph as "parabolic", "cubic", or "quartic" based on its shape. You should bring to the student's attention that some quartic graphs can look very much like parabolas, and that it may not be easy to distinguish between the two in some cases.