For my second assignment I chose to investigate
the equation ![]() and the effect on the original graph (when d =
0) when only the value of "d" is varied.
and the effect on the original graph (when d =
0) when only the value of "d" is varied.
Before examining this equation, let us look
at the equation ![]() .
.
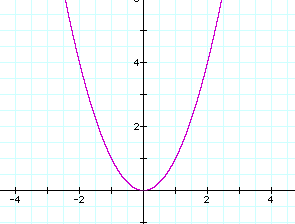
This is the basic parabola graph. When the equation is changed by adding a "-2", notice that the whole graph is shifted down the y-axis 2 units.
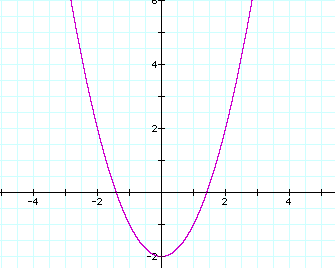
So now we will use this graph for the rest of the assignment.
Going back to the original assignment's problem,
![]() we have the above graph. Now we will change
the variable d to see what will happen to the graph.
we have the above graph. Now we will change
the variable d to see what will happen to the graph.
First let's give "d" the value of 5. Now we have the graph
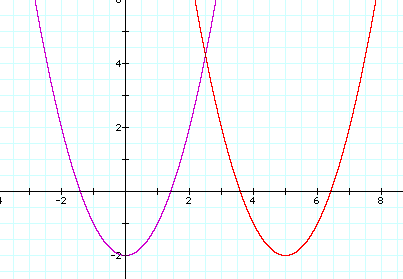
Notice that the vertex (and the whole graph) has shifted to the right of the original vertex five units. (red graph)
Let's look at another graph, this time with
d = 10. What happens? Let's see: ![]()
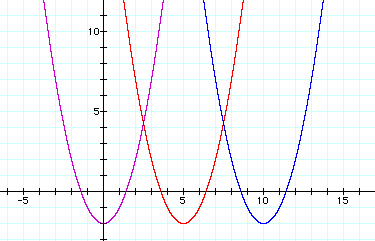
Now the vertex is located 10 units to the right of the original vertex. (blue graph)
What happens when we give "d" a negative value? Let d = -10.
So now the equation will be ![]() ,
which gives us the equation
,
which gives us the equation ![]() . Now
for the graph:
. Now
for the graph:
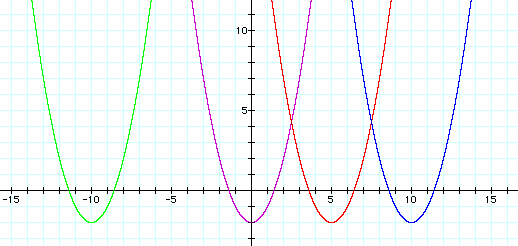
The vertex has now moved to the left of the original vertex. (green graph)
Let's see what happens when we use 2.5. The
equation will be ![]() . The graph will
be:
. The graph will
be:
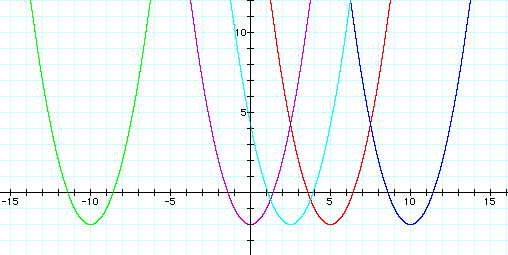
Since the graph shifted to the right 2.5 units when d = 2.5 (light blue graph), it would seem to follow that the graph would shift to the left 2.5 units if d = - 2.5. Let's see.
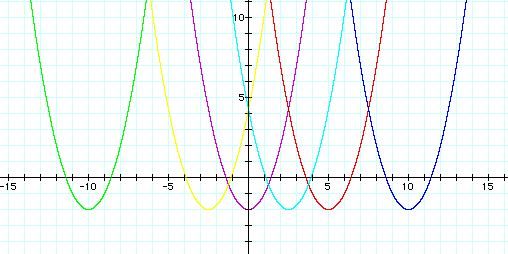
Yes, we were right! The graph did shift to the left as we anticipated. (yellow graph)
QUESTION: Does varying the value for "d" change the shape of the graph?
ANSWER: No, the original shape of the graph remained the same at all times.
QUESTION: Does varying the value for "d" change the position of the graph?
ANSWER: Yes, the variable "d" causes the graph to be shifted to the left, or to the right, or to remain the same (when "d = 0").