Our task now is to investigate the equation
Our
task now is to investigate the equation ![]() .
First let's see what happens when a, b, and k are all equal
to one.
.
First let's see what happens when a, b, and k are all equal
to one.
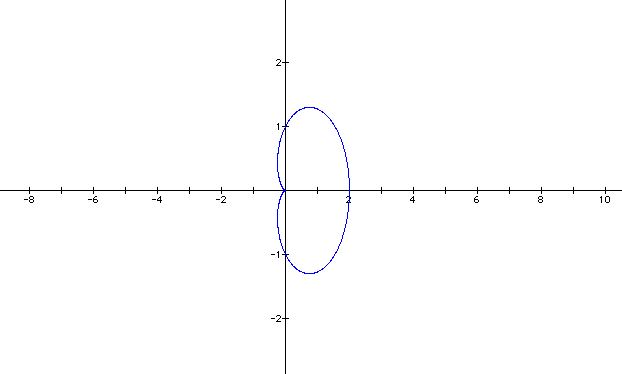
This is an interesting, uncomplicated graph. I have a feeling that it can become a lot more intricate when we vary the variables a, b, and k. That's what we're about to find out. Let's keep a and b constant for the time being and only vary k. Set a and b to two and k to 4. Let's see what we have.
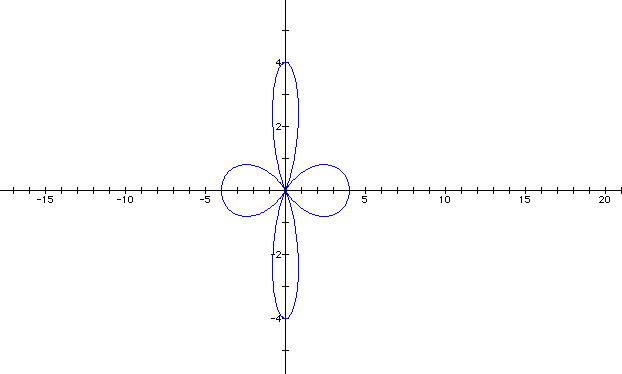
Neat! What we have here is what is known as the "n-leaf rose" graph. We get this by setting a and b to be equal and k is an integer. The number of leaves of the rose will be equal to the value of k. Like in our graph above k = 4, so the rose had four leaves. Let's do another one. Let a and b remain the same and set k to be 6.
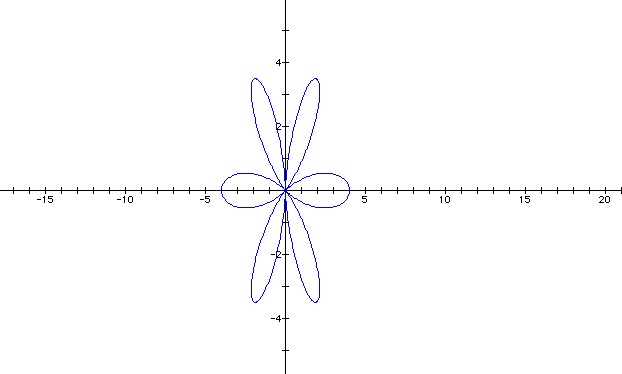
Awesome. But what happens if k is an odd number? Let's see.
The graph still has the same number of leaves as the number k, but now it's a bit skewed. It looks out of balance, doesn't it? I'm interested in knowing how the graph will look when k = 7. I bet you are, too.
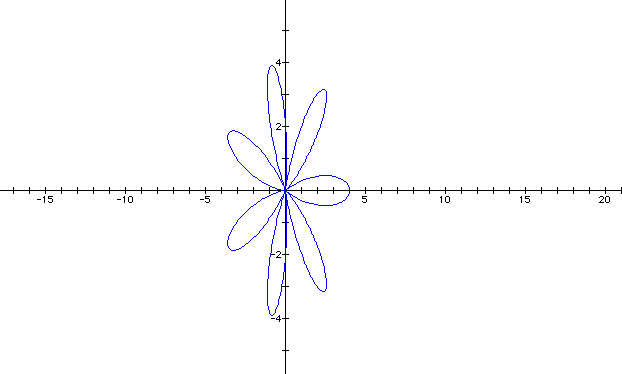
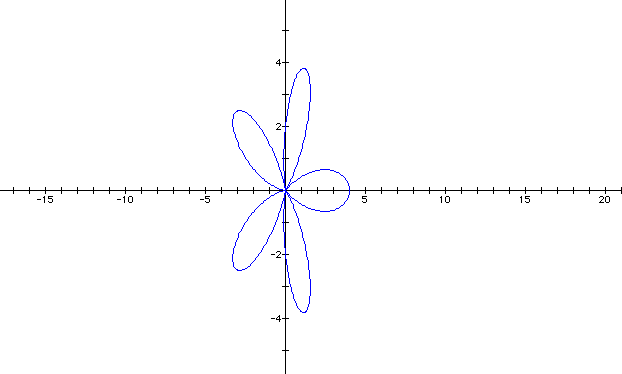
So it looks like the number of leaves will be equal to the value for k when a and b are held constant. With an even number there will be equal number of leaves on both sides of the y-axis. With an odd number, there will be an uneven number of the leaves on either side of the y-axis.
Let's set a = 6 and b = 4 and k = 4.
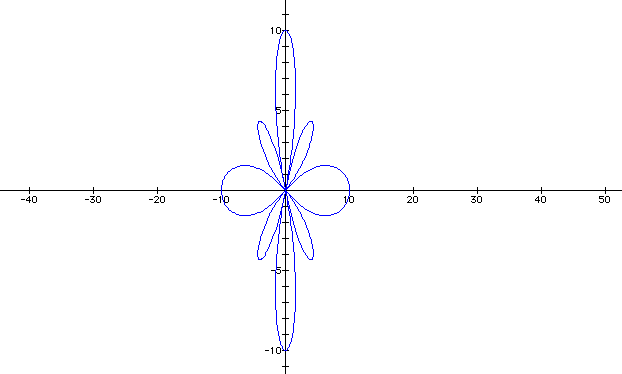
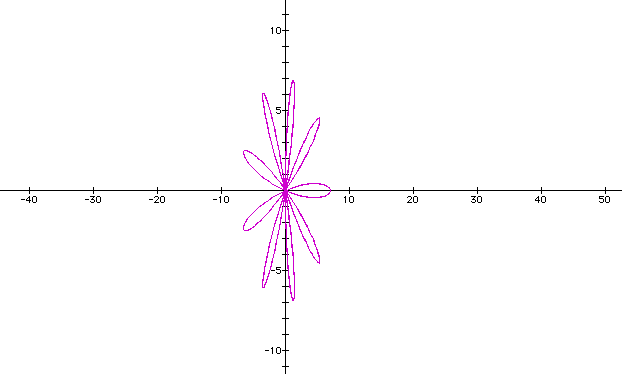
Let a = 7, b = 3, and k = 4. So we should have a four-leaf rose, but what affect will a and b have on the rose?
So we see that as a increases and b decreases, our rose spreads out as if it were melting. Let's see what happens when a decreases and b increases. Let a = 2 and b = 4, with k held at 4.
With our four-leaf rose, when b became larger than a, four new loops were created. As b continues to increase and a decrease, the number of loops remain at four but the size varies. Let a = 2 and b = 8, with k being constant. Let's look at one more.
Looking at our original equation ![]() ,
let's see what will happen if we disregard the a and just graph
the second part,
,
let's see what will happen if we disregard the a and just graph
the second part, ![]() . Let's use the
value of 7 for b and the value of 5 for k and see what happens.
. Let's use the
value of 7 for b and the value of 5 for k and see what happens.
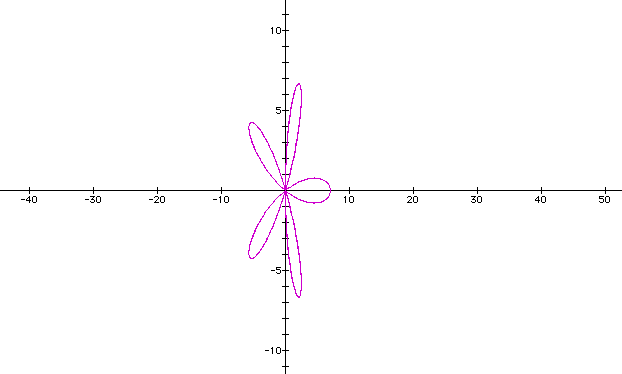
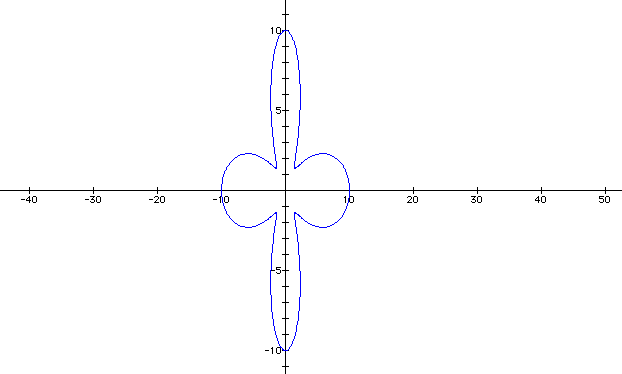
It doesn't look too much different from the original graphs. Let's hold b constant at 7 and vary k to see if there is any effect. Let k = 7.
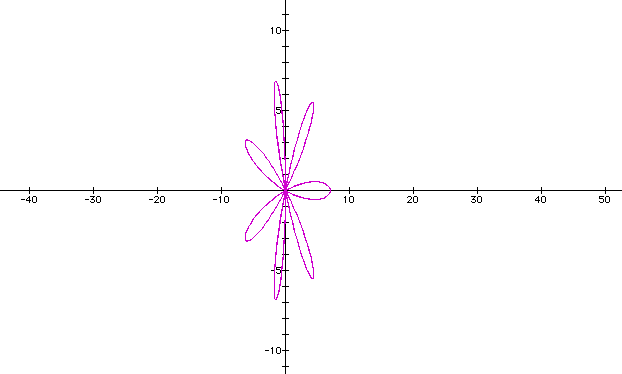
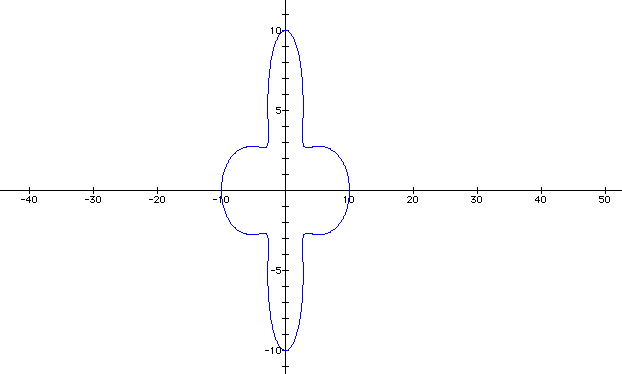
It doesn't look different yet. Let's have k to be larger than b and see what happens. Now b = 7 and k = 8.
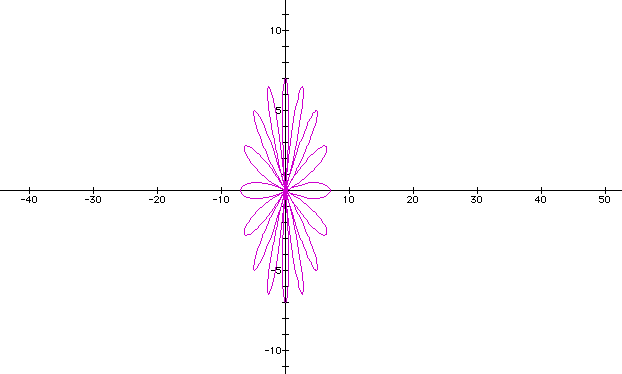
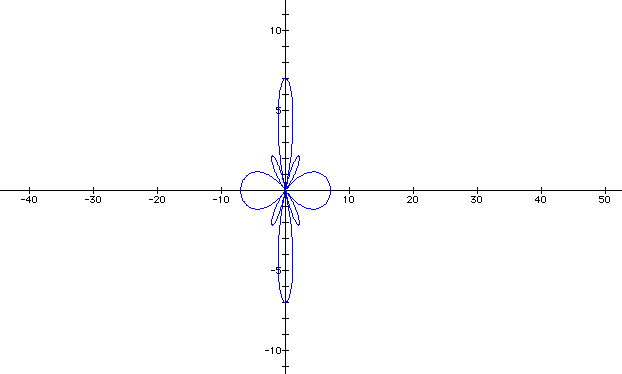
Now there's a difference! Let's do it one more time to see if anything else might happen. Let b stay at 7, and increase a to a larger odd number.
Look at that! When b is held constant and k is a larger odd number than b, the graph just has the same number of leaves as the number k. But when k is larger than b and is an even number, the graph's number of leaves is the doubled the number of k. That's interesting!