
Constructing a Sine Curve Using GSP
Constructing the Tangent Line and Its Trace
What kind of pattern does the tangent trace make as it is animated ?
Pedal Curves to the Sine Function
Some interesting related construction problems using Geometer's Sketch Pad (GSP) are: how does one construct a sine curve; how does one construct the tangent to a sine curve; and what do the pedal curves based upon moving the tangent to a sine curve look like and how do they behave as the pedal point is moved about? Answering these questions is a good exercise in using the features of GSP including animations of multiple objects. This essay will answer all of the questions above.
The first thing to do, of course, is construct a sine curve. Remember that a sine curve can be constructed by taking a wheel and marking a point on it and then tracing the locus of that point as the wheel is rolled along a surface. The trick is to simulate this effect in GSP. It turns out to be fairly simple to do this. Start GSP and on a new sketch first construct a segment. Now construct a circle of some diameter with its center on the segment. Then construct a point on the circle and through this point construct a line parallel to the segment. Construct a point on the segment and then construct a perpendicular line to the segment through this point. Construct a point at the intersection of the two lines just constructed. The sketch should appear as below.
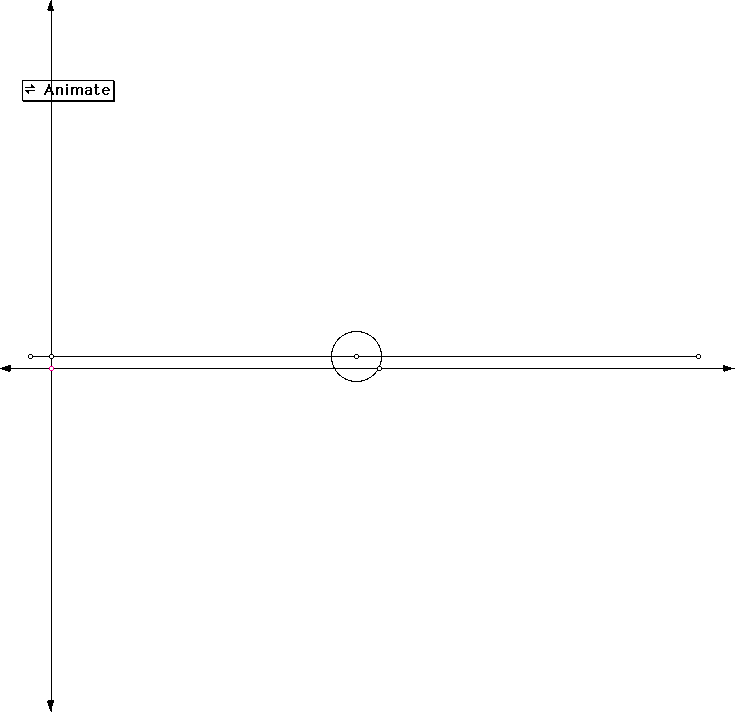
The next step is to animate the figure. Select the point of intersection and turn on the trace. Select, all at once, the point on the circle, the circle the point on the segment and the segment. Now choose EDIT-ACTION BUTTON-ANIMATE. The animation dialog will appear with two animations (SEE BELOW)
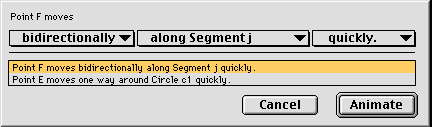
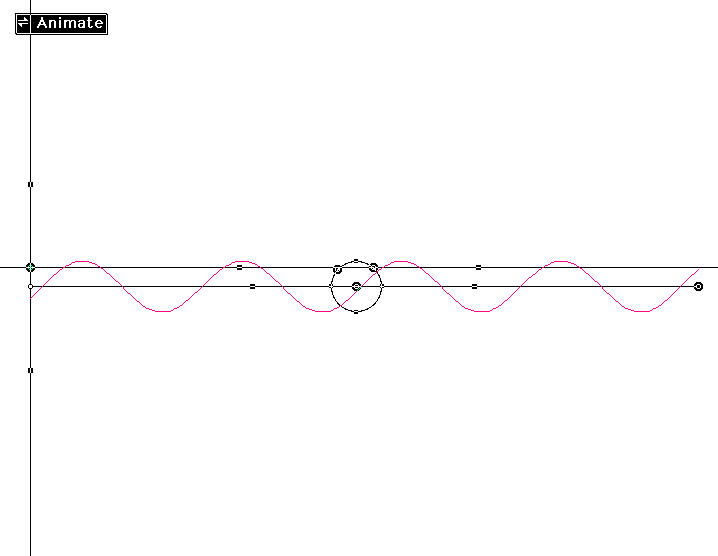
Change the action of point F along the segment from bidirectionally quickly to once normally. Change the speed of point E around the circle to normally. Click on animate and the animation button will appear as in the first picture. Now double click on the animation button and the sine curve will be traced along the segment (SEE BELOW).
To look at the GSP file that was used to create the images above click here. There are quite a few hidden objects in the sketch, so click on DISPLAY-SHOW HIDDEN to view them. It might be wise to wait until the tangent line has been constructed to do this.
Remember that the slope of the tangent to a sine curve varies between positive and negative one. What is needed is a way to get a line that behaves this way in synchronism with the point that traces the sine curve. The slope of the tangent line to a sine curve is zero at two different positions on the curve. Namely, at the maximum and minimum points of the sine curve. These points, of course, are when the angle whose sine is being calculated is either at 90 degrees or 270 degrees. The cosine of these particular angles is of course zero. These facts can be used in a clever manner to construct the tangent line. What is needed is a line that varies in slope from positive one to negative one that is 90 degrees out of phase with the point that is determining the sine curve trace. After some experimentation and resulting failures, the following construction was developed:
1. Find the quarter points on the circle used to generate the sine curve. These are equivalent to 0, 90, 180, and 270 degrees.
2. Construct a segment from the center of the circle to the point used on the circle that was animated to draw the sine curve.
3. Construct a line perpendicular to this segment.
4. Choose the point of intersection of this line with the circle that is 90 degrees behind the point used to construct the sine curve and construct a line parallel to the axis of the sine curve through this point.
5. Now draw a left half semi-circle from the 90 to 270 degree points on the circle.
6. Hide the circle and construct the intersection of the line constructed in step 4 and the semi-circle.
7. Construct a segment connecting the point constructed in step 6 and the 0 degree point on the original circle.
Now when the animation button is double clicked, the segment constructed in step 7 will oscillate back and forth along the semi-circle with a slope that ranges from -1 to 1.
8. Construct a line parallel to the segment constructed in step 7 that goes through the point that draws the sine curve. This line is the tangent to the sine curve.
Here are GSP sketches of the steps above. Click on each to see the associated sketch.
Click here to see the final product if your computer has GSP installed.
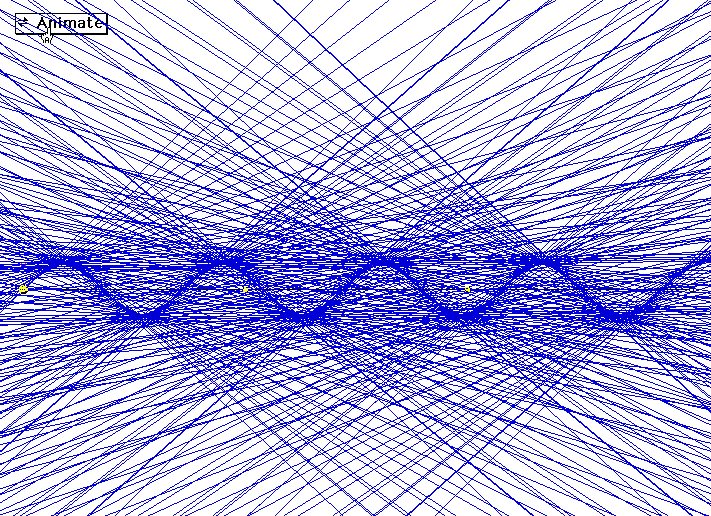
Interesting patterns can be created in GSP by turning on the trace of lines that are moved by animations. What do you think happens when we tell GSP to trace the tangent line to the sine curve and then do the animation? Well, what we have is a line which is moving along a curve at a constant rate while changing slope from -1 to 1 at a constant rate. What pattern do you expect to see as a result? Let's try the animation and see for ourselves.
This looks like a sine curve with an adjacent pattern of squares. This makes sense, doesn't it? The tangent is moving in a regular linear motion while varying in slope from -1 to 1 at a regular rate related to the sine funtion. Since the sine function is symmetric, why not the trace of the tangent to the sine function?
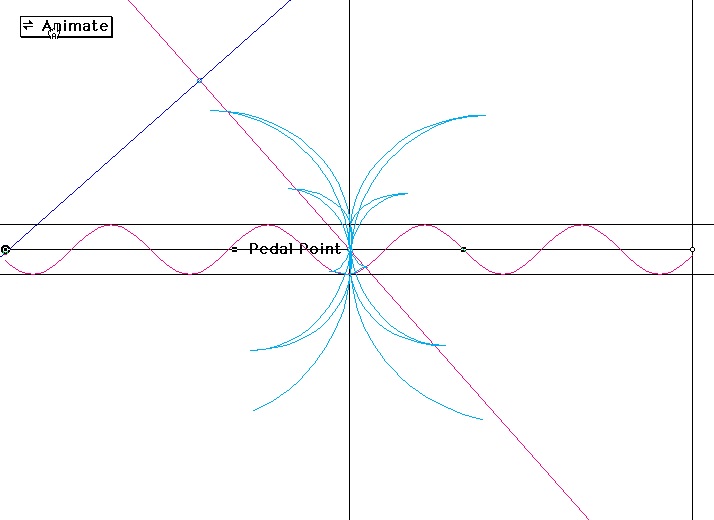
All that remains is to investigate the pedal curves to the sine function. In this context, a pedal curve is the trace of the point of intersection of the tangent to the sine curve and a perpendicular line containing a point called the pedal point as the tangent line is moved along the sine curve. The interesting thing to do here is to investigate various locations for the pedal point and observe the effect on the pedal curve. We begin by creating the first pedal curve. Begin by selecting a pedal point and constructing the line from the pedal point that is perpendicular to the tangent to the sine curve and constructing the intersection of the two lines. SEE BELOW.
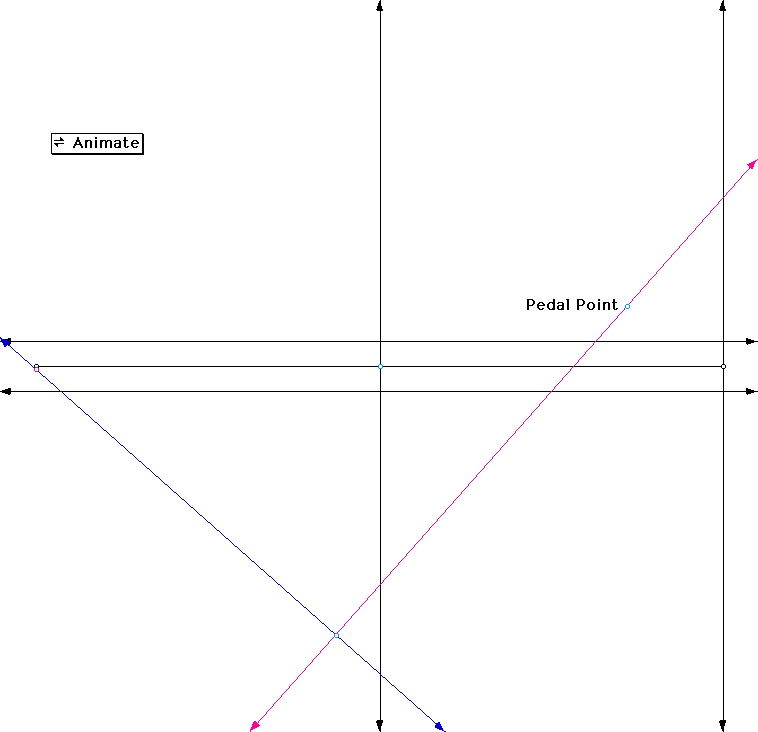
(This assumes that you have already set up GSP to animate the tangent line the sine curve as described previously. If not, then do so but don't trace the tangent.)
In the figure above, the intersection of interest is the intersection of the red and blue lines. Tell GSP to trace the interseciton point and then double click on the animate button. For this particular pedal point we get the figure below.
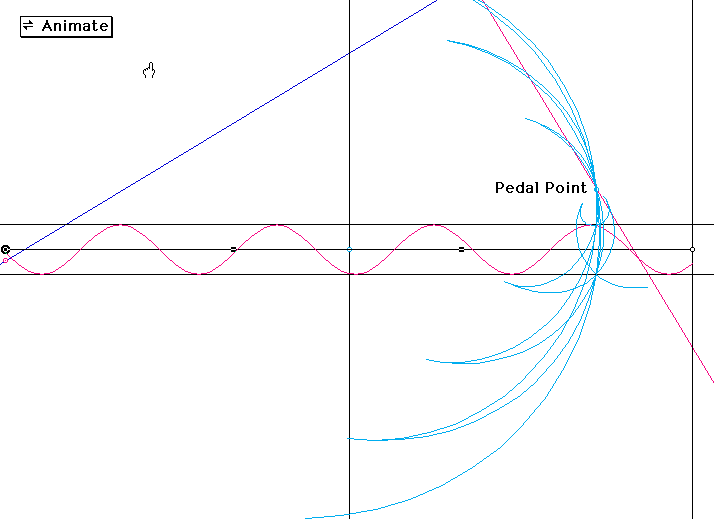
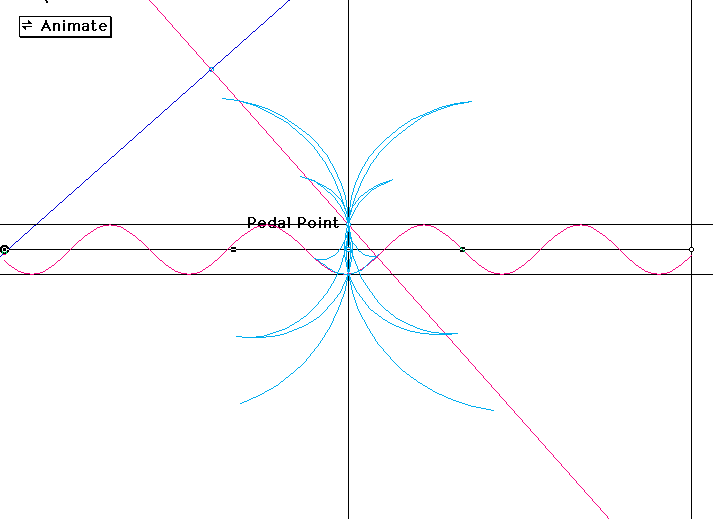
There seems to be a certain regularity to the light blue curve that is the trace we will call the pedal curve. Several sweeps of the curve intersect at the pedal point while several other sweeps of the curve intersect at two points on a line through the pedal point and perpendicular to the axis of the sine curve. These points are the intersecions of the lines drawn at the maximum and minimum of the sine curve and the line described above. It appears that there may be some symmetry about this vertical line. Let's move the pedal point to a line perpendicular to the segment used as the axis for the sine curve going through the center of this segment and see what happens. SEE BELOW.
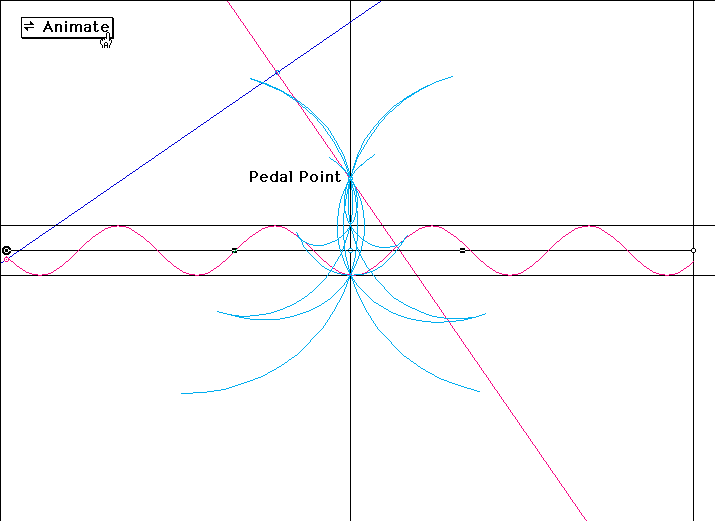
We again have the same intersection points and the picture supports the conclusion that the pedal curve is symmetrical about the line through the pedal point that is perpendicular to the axis of the sine curve. Notice that the pedal curve seems to favor the area below the pedal point. Is that a result of the placement of the pedal point? In this case the pedal point is above the sine curve. What if we moved the pedal point below the sine curve? SEE BELOW.
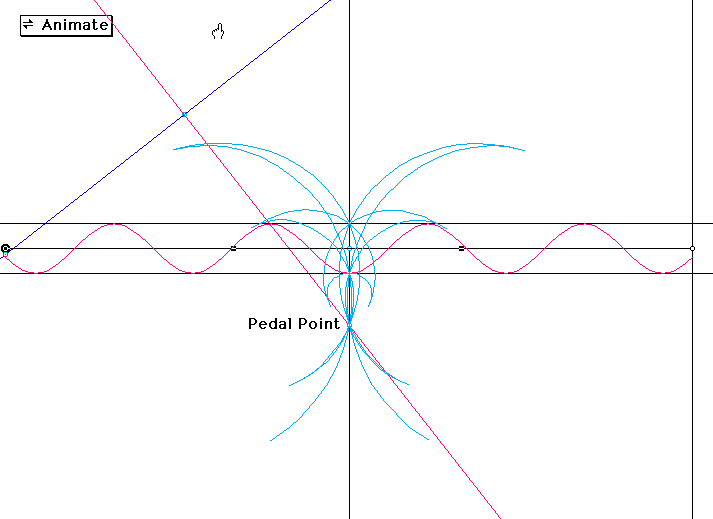
Now the pedal curve seems to favor the area above the pedal point. Other than that, all of our other observations remain the same. This seems to indicate that, if we placed the pedal point on the midpoint of the segment that we are using for the axis of the sine curve, then the pedal curve would have two axis symmetry. Let's try it and see. SEE BELOW.
This figure is inconclusive. It could be interpreted either way. The problem is the finiteness of the path used to create the sine curve. If the ratio of the path lenght to the amplitude were greater we might see more symmetry because the pedal curve would have more oscillations in its trace. We will try that later. First, what if the pedal point coincided with one of the other points of intersection on the pedal curve? Let's move the pedal point up to coincide with the intersection that occurs at the maximum of the sine function and the vertical line through the midpoint of our axis segment and see what happens. SEE BELOW.
Not very interesting. The shape remains basically the same, we have just eliminated one point of intersection. If you want to try it yourself, click here and you will get a GSP sketch on which you can move the pedal point and observe the results.
We have discussed tthree interesting topics here; the construction of a sine/cosine curve using GSP, the construction of the tangent to a sine/cosine curve, and the construction of the pedal curve to a sine/cosine curve. Of the three, I personally found that the investigation into how to construct a sine/cosine curve and the tangent to the sine/cosine curve to be the most interesting. For further investigation, it would be interesting to determine how to construct tangent and secant curves using GSP, if possible. (It is very easy to use the graphing capabilities of GSP to accomplish this. What would be interesting is how to use construction techniques not involving the graphing capabilities of GSP.) The pedal curve was very easy to construct. Moving it around gave a feel for how the shape of the pedal curve is influenced by the position of the pedal point. The pedal curves remind one of a fluer-de-lis or some kind of wierd bug. What might be interesting would be to extend the axis of the sine curve so that more cycles of the curve would be used to create the pedal curve. This could be simulated by decreasing the radius of the circle used to construct the sine curve. See the result below.
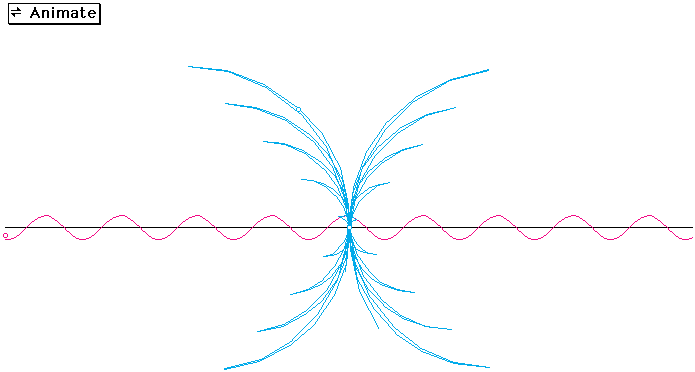
The effect seems to be that we just get more arcs on ea side of the pedal curve. The magnetude of the arcs seems to increase also. Other than this and changing the position of the pedal point, there is not much more of interest here. Again, constructing the sine/cosine curve and its tangent were the most interesting parts of this investigation.