Lesson Plans
Lesson 3
Instantaneous Rates of Change
Introduction:
In this lesson we will introduce the interpretation of the difference equation as the equation of the secant line. Through the use of Geometer’s Sketch Pad we will demonstrate what happens as the time used to calculate the average speed is reduced to zero and the velocity becomes the instantaneous velocity. We will generalize this concept to the secant line becoming the tangent line as the distance between x and c goes to zero. This is in preparation for introducing the derivative in the next lesson.
Instantaneous Velocity
Remember the average velocity formula from the previous lesson. This formula gives us the average velocity over a period of time. What if we were interested in the actual velocity at some point in time? Remember at the end of the last lesson the difference quotient was introduced. Look at the two expressions side-by-side below and notice the similarities.
![]()
![]()
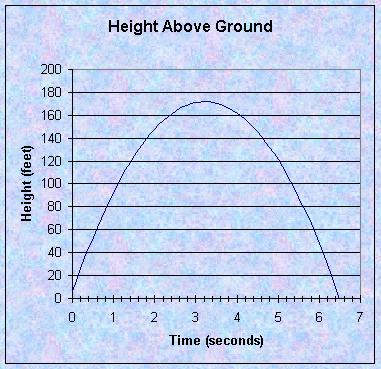
The expressions are almost identical. If we replace f (x) with f (t) and c with t0, we would have a difference equation that would calculate the average velocity from t0 to any time t. What would that look like? Suppose we throw a baseball up into the air as hard as we can. Neglecting the effects of the friction of the air on the ball, the function representing the distance of the ball above ground as a function of time would be quadratic and the graph of that function would be a parabola that opens downward. Lets say that the hardest you can throw a baseball is 70 mph. That is roughly 103 feet per second. Suppose that when you release the baseball it is 6 feet above the ground. The equation for distance above the ground would be: d(t) = -16 t2 + 103t + 6. Suppose we wanted to know what the average velocity of the baseball with relationship to t0 = 0.5 seconds and other values of t up to the time the ball hits the ground. The difference quotient becomes:

What does this represent? Let’s look at this graphically. The graph below represents height above the ground with respect to time according to our distance function above.
But what does the -16t + 95 represent? Suppose we let t = 4. The line connecting the point on the graph at t = 0.5 and the point on the graph at t = 4 has a slope of -16(4) + 95 or 31. This is illustrated in the graph below.
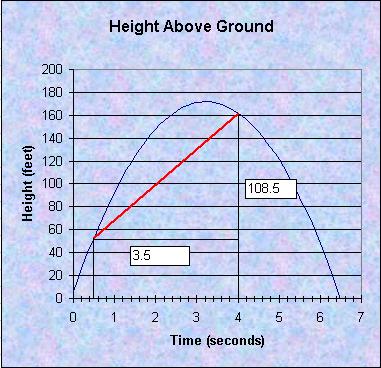
So, the difference quotient gives us the slope of line connecting the point c to any other point x on the curve of our function. This line is called the secant line. What would happen if we moved t closer to 0.5? Say, what would the line look like if t = 1?
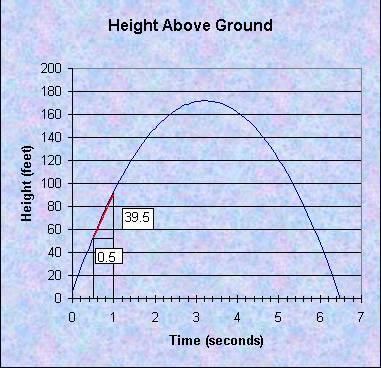
Now the secant line is much steeper and almost matches the curve of the parabola. We can show that the secant line becomes the tangent to the curve when the distance between t and c becomes zero. The tangent to the curve can be interpreted as the instantaneous rate of change of the function in the direction of the slope of the curve. So in this case, if we let t = 0.5 we see that the slope of the curve at 0.5 is 87, so the instantaneous velocity at 0.5 seconds is 87 feet per second.
Now use the five GSP sketches on the Unit Outline to demonstrate this concept further.