The parabola, of general equation
can be studied thoroughly if we study the variation of the graph of the parabola keeping two of the parameters fixed and changing the third one. Thus, in the following table we summarize the graphical variations, we always consider the two non-varying parameters equal 1:
|
When a>0, b=1 and c=1, the parabola has a minimum at its vertex. When a<o, b=1 and c=1, the parabola has a maximum at its vertex. |
 |
|
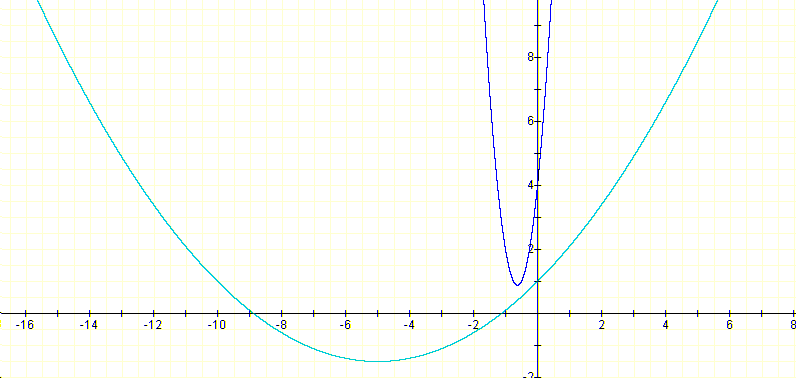
When |a| is very small (less than 1) the parabola is very open and large. Notice that the derivative will be a straight line with a slope very small. At some points almost horizontal. When |a| is very big the parabola is skinny. Notice that now the derivative is a straight line with very big slope. When x is large the slope will be almost vertical. |
 |
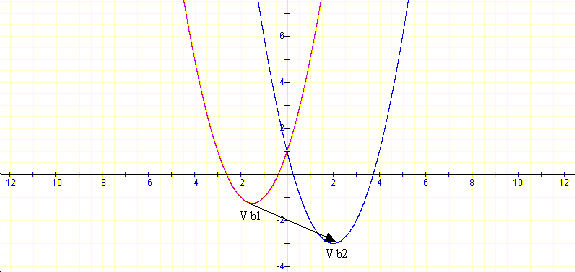
| When b varies, a=1 and c=1, the parabola moves on the plane. For b1 different than b2 we obtains two parabolas such that one is a translation of the other through the vector that takes, for example, the vertex of one two the vertex of the other. Go to "Moving a parabola on the plane" for a series of tasks about parabolas. |
 |
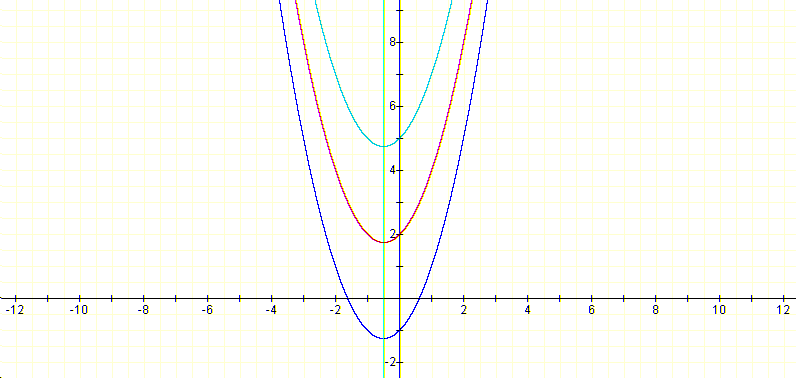
| When c varies, a=1 and b=1, we have a particular case of movement of the parabola: The parabola moves vertically along its axis by the value c. Thus, for example, the red parabola below moves to the dark blue when we subtract 3 to its equation, and moves to the light blue when we add 3 to its equation. |
 |
We will now pose some problems that can be used in the classroom to explore parabolas:
***************************************************************************************************************
What is the locus of the vertex of the parabolas of equation:
when b varies across the real number line?
***************************************************************************************************************
The vertices are points which x-coordinate is such that the parabola attains a minimum (note that the coefficient of x is positive) at that point. Thus, if we compute the derivative and find its zero we find the x-coordinate of the vertex of the parabola:
And to find the y coordinate we can substitute in the parabola and get
The curve we are looking is the locus of the points:

Which is a parabola in -b/2.
Note that the students could have a very different approach. For example, after drawing in the Numerical Calculator (Graphical calculator) several parabolas for a set of values of b, they can with the cursor find out what are the coordinates. They can enter the coordinates of the vertices in a spreadsheet, and compute first and second differences before they try to guess the equation of the parabola. The set of tasks that the teacher can try, in this case, will be of another nature.
***************************************************************************************************************
What is the locus of the vertices of the parabolas
when a varies across the real number line?
***************************************************************************************************************
In this case the locus of the vertices is the line:
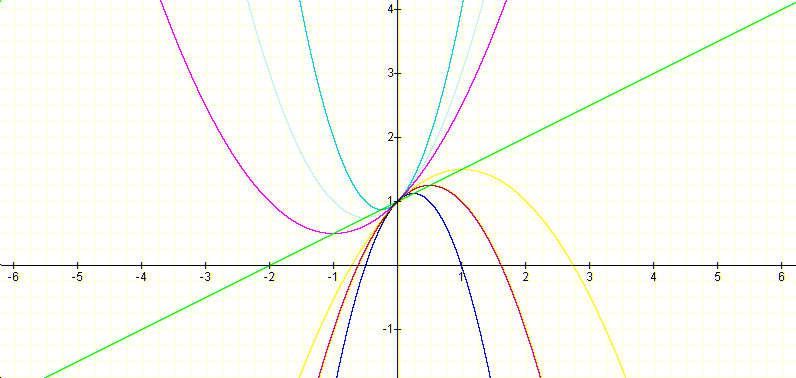
In fact the equation can be guessed form the graphic first and check through the derivative. If we consider again the extreme point for each of the parabolas, that is the x-coordinate of the vertex of the parabola, we have that is attained at
its extreme value is:
which is a line in -1/2a.
***************************************************************************************************************
Discuss the number of zeros of:
1. When b varies across the real number line.
2. What happens if c is -1 instead of 1? Can we generalize?
***************************************************************************************************************
Part a) can be approached by studying the graph of:
in the xb plane, that is studying b as a function of x:
then we know that if -2<b<2 the parabola does not have any zeros, if b=2 or -2 that parabola has only one zero, and if b<-2 or b>2 the parabola has two zeros.
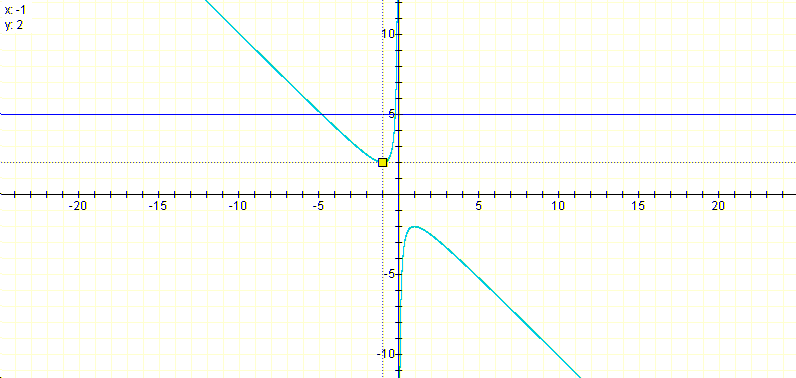
In the Graphical Calculator we can animate the line y=b to move up and down the plane parallel to itself and see instantly which are the zeros of the parabola for the b chosen.
If c is -1 then:
for all b. The graphic of b in function of x becomes:
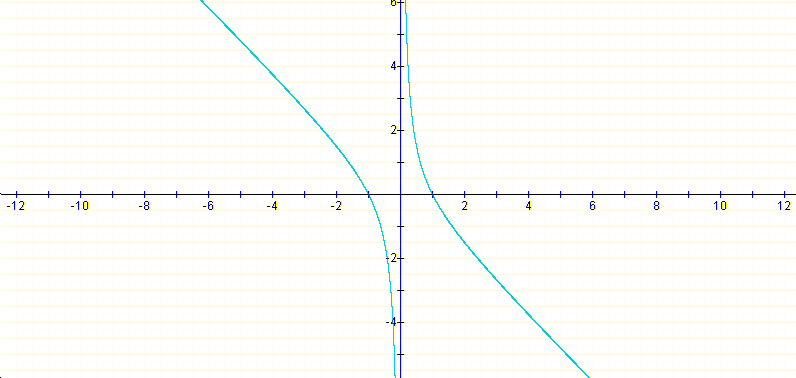
Showing clearly that for all b the parabola has always two roots.
Now, if we fix a c>0 and we want to find out the range of b for which the the parabolas:
have two roots, we can plot the function
and solve the inequation graphically:
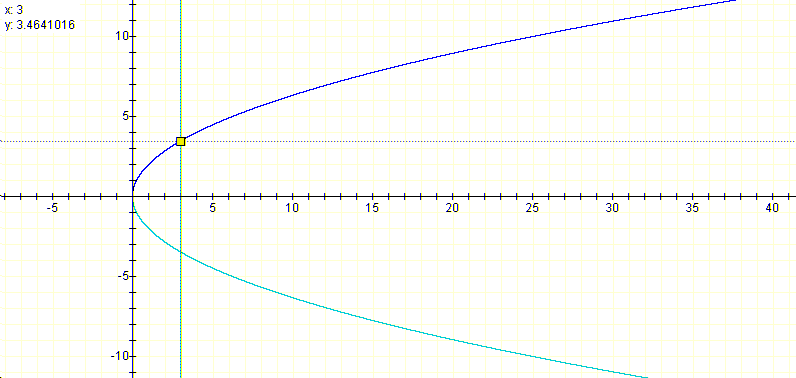
For a particular value of c, the b's for which the parabolas have no roots can be found by using the plot lines in the Graphical calculator over the intersection of the line x=c and the graph of the curve (see example above). The complement of this interval will be the range for b in which the parabola has two roots.
**************************************************************************************************************
Consider now the parabolas of equation:
where c varies along the real number line. Classify the roots of the family of parabolas studying the graph of y=0 as a function c depending on x.
**************************************************************************************************************
Graphing the curve of equation:
we obtain a parabola:

The maximum value of this parabola is the value of c for which the original parabola has only one zero and the point at which the maximum value is attained is -b/2 (in the present case b=5). If c is greater than this maximum value then the parabolas have no zeros and if c is smaller than the maximum value the the parabolas have always two roots.
**************************************************************************************************************
Studying the zeros of the family of parabolas
studying the curve as a function a(x).
**************************************************************************************************************
Plotting the curve we get:
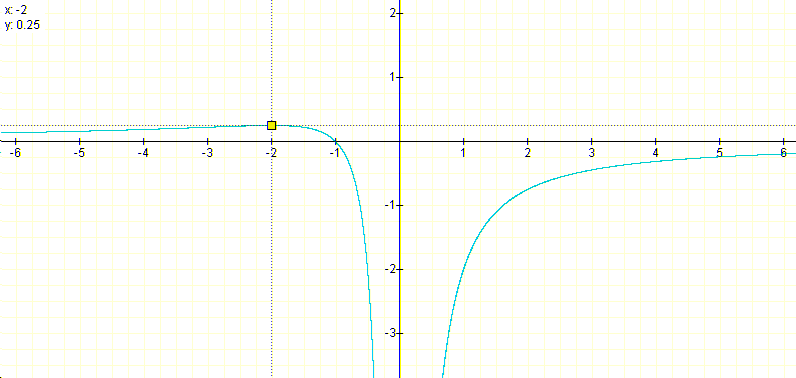
With the plotting lines we can find the maximum value for the function (in this case x=-2 and a=0.25 (note that in the above picture y is a); for this value of a the parabola has only one zero. If a<-0.25 we have always two zeros, and if a>0.25 the parabolas have no zeros.
In any of the studies we have made before the graphs will display not only how many roots the parabola has but also if the roots are positive, negative or nule.