
Comparing Car Values
The Regression Values of Used
Cars
By Ruth M. Naugle
Comparing Car Values
The Regression Values of Used
Cars
By Ruth M. Naugle
What is important in a brand new car? Is it the color? Maybe the gas mileage? Or maybe the resale value? In an unsuccessful attempt to justify myself buying a new car, five similar cars will be compared for their regressing value. I'm sad to say my favorite car, Chrysler Sebring, did the worst!
Five similar cars are compared for the new car cost and then the expected cost for the next five years. The five cars are convertibles and all within $2,000.00 of the new car sticker price. Let's look at the cars. Click for details on edmunds.com
Chrysler Sebring
Chevrolet Camaro Pontiac Firebird
Ford Mustang Toyota Camry Solara
Convertible GTC 2 dr
Convertible 2dr
Convertible 2dr Deluxe 2dr conv.
SE V6 2dr Convertible
(2.7L 6cyl 5M)
(3.8L 6cyl 5M)
(3.8L 6cyl 4A) (3.8L 6cyl 5M)
(3.0 L 6cyl 4A)
New: $26,894
$27,990
$27,555
$24.458
$29,600
1 Year: $17,076
$19,414
$18,965
$18,103
$21,943
2 Year: $14,743
$17,007
$16,922
$16,240
$19,303
3 Year: $12,689
$14,888
$15,125
$14,601
$16,981
4 Year: $10,869
$13,009
$13,531
$13,148
$14,923
5 Year: $9,235
$11,323
$12,101
$11,845
$13,076
With the car costs in hand, now
it is time to fit the data to an equation. The values most represent
a cubic regression graph. The R-Sq values are listed below.
Chrysler Sebring
Chevrolet Camaro Pontiac Firebird
Ford Mustang Toyota Camry Solara
0.990
0.992
0.990
0.993
0.995
Now let's find the cubic equation of best fit.
Sebring y=26609.9-(11596.8*x)+3311.11*x^2-(339.167*x^3)
Camaro y=27758.5-(10063.6*x)+2737.89*x^2-(278*x^3)
Firebird y=27306.5-(10146.5*x)+2896.63*x^2-(296.704*x^3)
Mustang y=24290.1-(7443.6*x)+1995.91*x^2-(202.074*x^3)
Solara y=29415.6-(8899.04*x)+2240.32*x^2-(224*x^3)
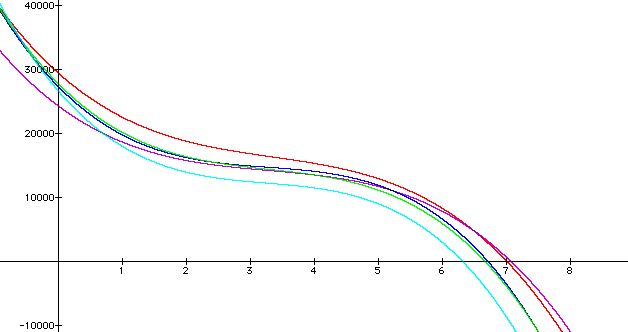
Notice which cars held their value. While the Toyato
costs the most new, it also had the highest resale value. On the
other hand, the Mustang cost the least new, but was next to the highest
value after five years. My personal favorite, the Sebring, had the
lowest value after five years.
This graph not only shows the car values of the first five years, but the expected trend of the car values. There are many discussion questions that will benefit classes.
1. Why is the R-Sq value not equal to 1? Would you consider the R-Sq values of 0.990 a strong correlation?
2. Do you think a linear graph would better represent
the data and have a higher R-Sq value? Why?
Do you think a quadratic graph would better represent
the data and have a higher R-Sq value? Why?
3. Looking at the graph, do we need to restrict the range of the graph? What quadrant will the actual graph lie? Why?
4. What do you think the car values will be in years six and seven? Do you think they will continue to follow the cubic regression equations? Explain.
5. In what year does the car value drop the most?
What does this tell you about buying a new car? Almost new car?
Return to Naugle's Homepage