
Department of Mathematics Education
J. Wilson, EMAT 6680

This investigation serves as introduction to the polar coordinate system and polar equations. We will begin with a discussion of the polar coordinate system and develop an understanding of basic polar equations that produce a few of the "famous" families of curves, specifically spirals, cardioids, and n-leaf roses. There are many other "famous" curves to be explored and each aspect of this investigation could be explored with more depth. This investigation should serve as a good reference tool and spring-board into other investigations.
These demonstration graphs have been produced using the graphing calculator software, Graphing Calculator 2.2.1. If you do not have this software, you can use a demo version, or purchase the software through the internet at http://www.pacifict.com. These demonstrations can also be created using other graphing software, or graphing calulators.
The Polar Coordinate System
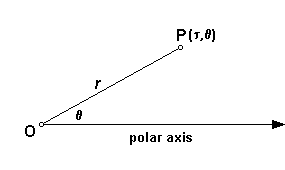
Polar equations are based upon the polar coordinate system, which is constructed as follows.
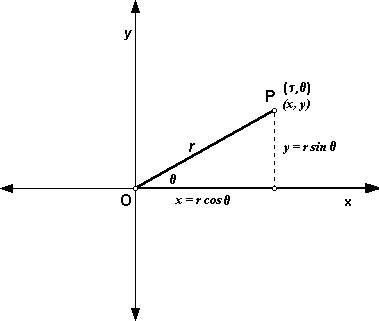
The relationship between polar coordinates and rectangular coordinates are as follows.
A Look at Polar Equations
Spirals:
The spiral family of curves is produced by the general equation r = aq.
The following graph is of the equations:
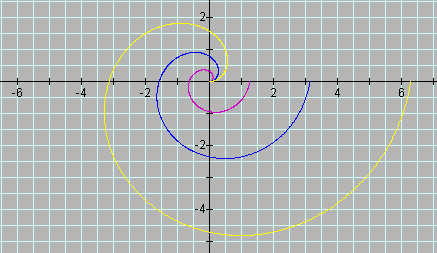
a controls the "size", or "tightness", and is the scalar of the spiral. The range of q in the graph represents 1 positive, and therefore, counterclockwise rotation. As qmax is increased to +infinity, r increases to +infinity. Adjusting the range of q produces the following graph:
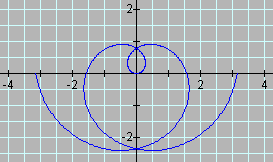
The graph now includes 1 negative, and therefore, clockwise rotation. As qmin approaches -infinity, r approaches -infinity. Negative and positive rotations result in a "mirror image", or a "flip" about the vertical axis. Revisiting a, when a is negative, the following graph is produced.
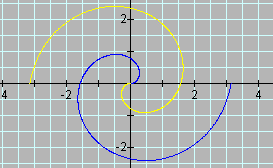
The negative produces a rotation by p (or -p) of the +a graph.
To explore the spiral family of curves more using Graphing Calculator 2.2.1 as a helper application, click here.
Cardioids:
The cardioid family of curves are named for their heart shape and are produced by the following general equations.
Similarities among cardioids:
The following graph is of the two most basic cardioids.
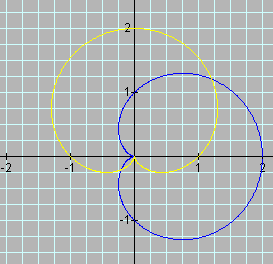
Replacing cosine with sine results in a p/4 rotation of the cardioid. Notice the intercepts of each of the graphs in relation to the corresponding equations. Looking at just cosine cardioids, the effect of a is shown in the following graph.
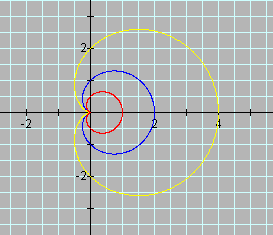
a controls the "size" and is the scalar of the cardioid. Again, notice the intercepts of each of the graphs in relation to the corresponding equations. The horizontal intercepts are 0 and 2a and the veritical intercepts are a and -a. a has the same effect on sine cardioids, but remember to take into account the p/4 rotation. Therefore, the horizontal intercepts are a and -a and the vertical intercepts are 0 and 2a. If a is negative, the following graph results:
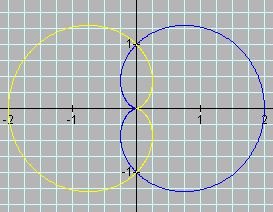
-a produces a "flip" about the vertical axis. -a has the same effect on sine cardioids, but the "flip" is about the horizontal axis.
To explore the cardioid family of curves more using Graphing Calculator 2.2.1 as a helper application, click here.
n-Leaf Roses:
The rose family of curves are named for their flower shape and are produced by the following general equations.
Similarities between rose and cardioid equations:
The following graph is of n-leaf roses, when n is odd.
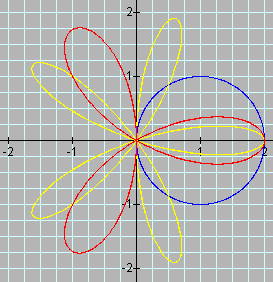
To obtain an odd n-leafed rose, the range of q must equal the distance of p. The range can include any combination of qmin and qmax, as long as the rotation distance equals p. Therefore, the standard default of qmin = 0 and qmax = 2p graphs the set of all points twice around the curve. n = the number of leaves of the rose. When n = 1, a special case arises, the 1-leaf rose is a circle. Notice that the intercepts are at 0 and a.
To explore odd-leaf roses more using Graphing Calculator 2.2.1 as a helper application, click here.
The following graph is of n-leaf roses, when n is even.
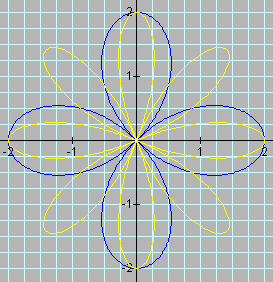
To obtain an even n-leafed rose, the range of q must equal the distance of 2p. The range can include any combination of qmin and qmax, as long as the rotation distance equals 2p. Therefore, it is standard to set qmin = 0 and qmax = 2p. n = 1/2 the number of leaves of the rose. Notice that the intercepts are at 0, a, and -a.
To explore even-leaf roses more using Graphing Calculator 2.2.1 as a helper application, click here.
If you have any comments concerning this investigation that would be useful, especially for use at the high school level, please send e-mail to esiwdivad@yahoo.com.
Return to my homepage.