
Assignment 10
An Introduction of Plane Curves and Polar Coordinates using the Graphing Calculator 2.1 (GC2.1)Software
T. Barron
The graph of an equation y = f(x), where f is a function, is often called a plane curve. However, to use this as a definition is restrictive, since it rules out most of the conic sections and many other useful graphs. Thus, for most applications, we define the plane curve as the set of C of ordered pairs of the form (f(t), g(t)) where the functions f and g are continuous on an interval I.
Now, let C be the curve consisting of all ordered pairs (f(t), g(t)), where f and g are continuous on an interval I. The equations x = f(t), y = g(t), where t is in I, are called parametric equations for C, and t is called a parameter. If we are given the parametric representation, then as t varies through I, the point P(x, y) traces the curve. Sometimes it is possible to eliminate the parameter and obtain an equation for C that involves the variables x and y.
The basic parametric equations we usually start with as classroom examples are:
x = cos(t) and
y = sin(t),
0 £ t £ 2p .
Here, we may use the identity cos2t + sin2t = 1 to eliminate the parameter. This gives us x2 + y2 = 1, and hence points on C are on the unit circle with center at the origin. As t increases from 0 to 2p , P(t) starts at the points A(1, 0) and traverses the circle once in the counterclockwise direction.
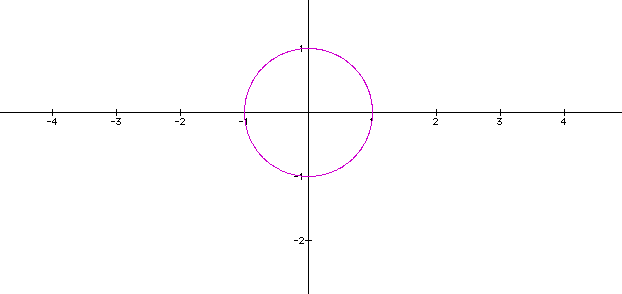
Figure 1
x = cos(t), y = sin(t)
or
x2 + y2 = 1
Now, using GC2.1 or a similar graphing program or calculator, we can have the students sketch both the graphs of x2 + y2 = 1 and x = cos(t) and y = sin(t) to verify that they are indeed the same graph as pictured in the figure above.
To further our investigation, we can graphically look at changes to the original equations such as:
x = a cos(t)
y = b sin(t)
for 0 £ t £ 2p
for various a and b.
In the above equation, letting n = 1, we solve the equations for cos t and sin t, then square the quantity and add to obtain:
(x/a)2 + (y/b) 2 = x2/a2 + y2/b2 = 1
Note, from the figures below, that this equation, and thus the parametric equations, represent an ellipse. Click here for a more detailed explanation of ellipses and conic sections.
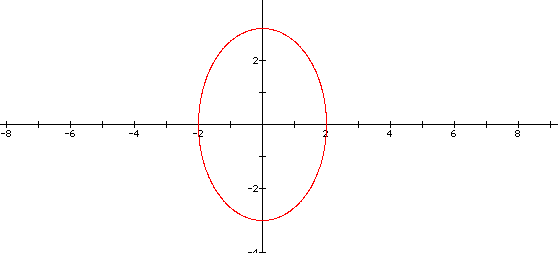
Figure 2
x = 2 cos(t), y = 3 sin(t)
Figure 2 above represents the graph of
x = 2 cos(t)
y = 3 sin(t).
Note that 2 = a is where the ellipse intersects the x-axis, while b = 3 is where the ellipse intersects the y-axis. Thus, teachers may explore other investigations such as shown in the figures below when a > b, and when a = b. Note that when a > b, the major axis is the x-axis, and when a = b, the ellipse is actually a circle.
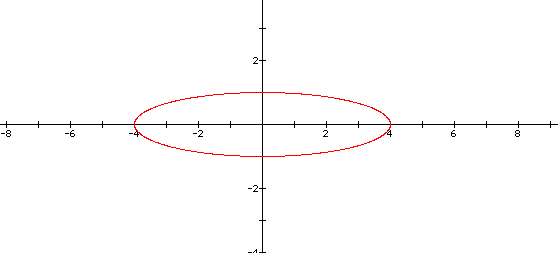
Figure 3: x = 4cos(t), y = sin(t)
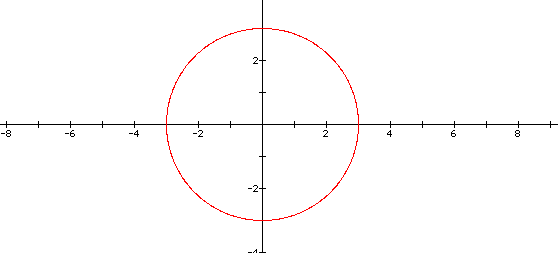
Figure 4: x = 3cos(t), y = 3sin(t)
Using a program such as GC2.1, teachers can help students to understand the relationship between familiar equations in the Cartesian plane and the new parametric equations. Students should become familiar with parametric equations because future mathematical questions will incorporate such equations. For example, the cycloid, which is the curve traced by a point P on the rim of a wheel as the wheel rolls along a straight line without slipping, is much easier to graph using parametric equations versus the Cartesian equation. Thus, the significance of parametric equation in relation to the parametric equations for a cycloid [x = a(t - sin t), y = a(1 - cos t)] may be a topic to discuss with students to help them understand the significance of parametric equations.