
Assignment 2 #4: Interpret your graphs. What happens to y = ax^2 + x +2 as a is varied? Is there a common point to all graphs? What is it? What is the significance of the graph where a = 0? Do similar interpretations for other sets of graphs. How does the shape change? How does the position change?

The graph of y = ax^2 + x + 2. I will find out if there is a common point to all the graphs if a is varied in this problem. As you can see, this equation graphs a parabola and it intersects the y - axis at positive 2. My hypothesis #1: as a changes, the parabola will widen; hypothesis #2: but, it will continue to cross the y - axis at positive two. I will continue to find out if my hypothesis holds true. Keep in mind that in the equation, ax^2 + x + 2, a is a coefficient of x^2, the coefficient of x is 1, and the constant is 2.

The graph of 2x^2 + x +2 and the graph of ax^2 + x + 2. My hypothesis #1 was incorrect, however, my hypothesis #2 was correct. What will happen if I vary a to a negative number? Will it widen the parabola? Will it change the parabola in the opposite direction? Will it make the parabola become a hyperbola? You must be able to distinguish between the two terms!

As you might have guessed, the parabola is flipped to the other side of the graph and still intersects the y-axis at positive two.
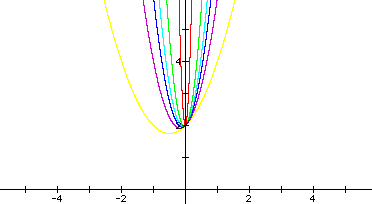
Let's take a look at the graphs of positive, even integers. Look at what the graph shows when we set a= 2, 4,6,8,10,20, and 100.

What type of conjecture can you make about these types of equations? Notice that all parabolas cross the y-axis at positive two. What can we say about this? What will happen when we set a = odd numbers? What will happen when a = 0?

The graph of ax^2 + x + 2, where a = 1, 3,5,7,13, and 101. There is no significant difference between the graphs of evens versus odds, but if you notice how wide the parabola is on the yellow curve (this is the graph of x^2 + x + 2) versus the graph of the red curve (this is the graph of 101x^2 + x +2). Still all graphs are intersecting at y = 2.
We will now turn our attention to the graph of ax^2 + x + 2 where a = 0. What do you think will happen to our graph? Keep in mind that when you multiply zero by any number, your product will be....you guessed it...zero!

I hope you guessed a straight line as I did, because if you have x + 2 left, this equation automatically results in a linear function. This equation crosses the x and y axis at x = -2 and y = 2.

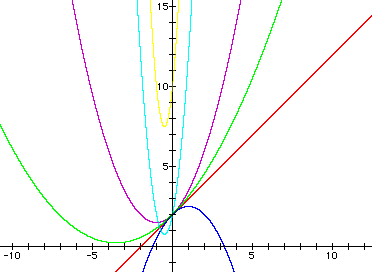
What do you think happened to this graph? What types of values were the inputs? All graphs again cross at y = 2 except for the yellow graph. Why is that? All constant values in the equations above stayed the same except for the yellow graph, therefore the constant changed in the equation, to 10 (this is where the parabola crosses the y-axis. The light blue graph seems to "protrude" in this graph and the reason is due in part because I gave a coefficient to the x value, so the equation became y = 5x^2 + 5x +2. The purple graph is that of the equation y = (1/2)x^2 + x+2. It seems to look a lot like the graphs of the equations above. The green graph is that of y = 0.14114111411114x^2 + x+2 (the coefficient of x^2 is an irrational number. The graph of this equation is very wide, but it does still cross through the y-axis at y = 2. You have learned what the red line's equation is, so no further discussion is needed. I wonder if you can recall the equation of the blue graph (or one that is similar to it)? If you said it was a negative graph, you are correct!!! In fact it is -(1/2)x^2 +x+2.