
Stephanie K. Lewis
Assignment 10
EMAT 6680
Fall, 1998
Investigate each of the following for 0 £ t £ 2Õ . Describe each when a = b, a < b, and a >b.

When a = b, the graph of the function is a circle. The radius of the circle is the value of a (or b).

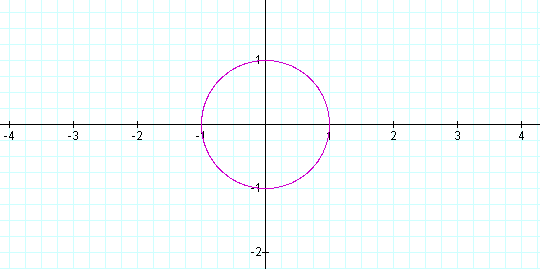 As the value of a and b increases or decreases, the radius of the circle whose center is at the origin becomes larger or smaller, respectively. For example, let a = ½, and b = ½ in the function below.
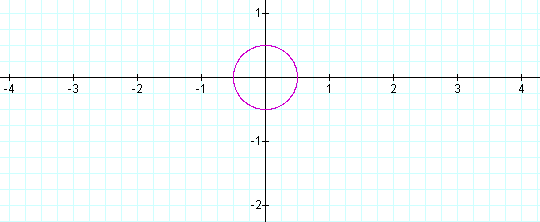
Then the graph of this function looks like the illustration below.
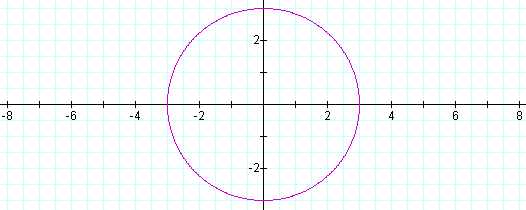
Now, let a = 3 and b = 3. Then, the equation

has a graph of a circle whose radius is 3, and whose center is at point (0,0) is illustrated below.
When a > b, the graph is an ellipse whose center is at the origin, and whose major axis extends from –a to a. The minor axis extends from b to –b. For example, let a = 2 and b = 1. Then the equation

has a graph of
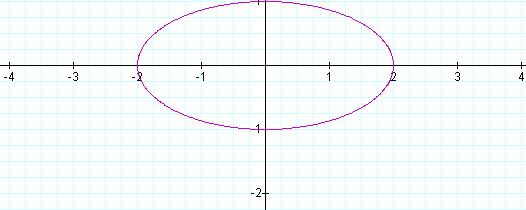
The major axis is along the x axis, and the minor axis is along the y axis.
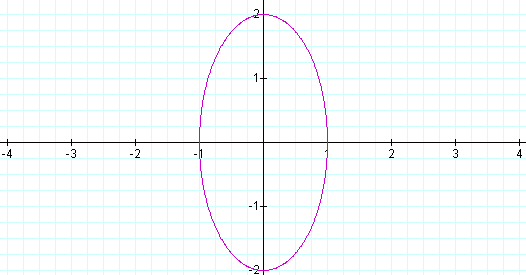
On the other hand, if a < b, the major axis of the ellipse is along the y axis, and the minor axis is along the x axis.
Let a = 1 and b = 2. Then the equation and graph is illustrated below.

If we wanted to explore other graphs, then the parameters of the original equation can be changed.