Problem:
The following data is from the lumber industry, giving the approximate number of board feet of lumber per tree in a forest of a given age. What function will fit the data? Predict the harvest for ages other than those given.
| Age | Length (x100) |
| 20 | 1 |
| 40 | 6 |
| 60 | |
| 80 | 33 |
| 100 | 56 |
| 120 | 88 |
| 140 | |
| 160 | 182 |
| 180 | |
| 200 | 320 |
First, enter the data on a spreadsheet application. I chose to use Microsoft Excel for the exploration.
The entered data looked like this:
| Age | Length (x100) |
| 20 | 1 |
| 40 | 6 |
| 60 | |
| 80 | 33 |
| 100 | 56 |
| 120 | 88 |
| 140 | |
| 160 | 182 |
| 180 | |
| 200 | 320 |
Once the data is entered on the spreadsheet, utilize the Chart Wizard to create a graph of the data. The first graph looked like this:
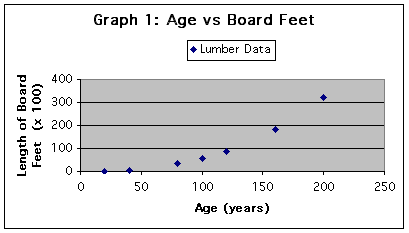
Next, try to fit a curve to the data. What types of curves look like this? It definitely does not appear to be linear. Is it a quadratic equation? Is it a cubic function? Does it appear to be an exponential growth?
Try fitting the following curves to the data:
Quadratic function: y = x^2
Cubic function: y = x^3
Exponential function: y = e^x.
How do these match? The quadratic curve does not match perfectly as seen below:
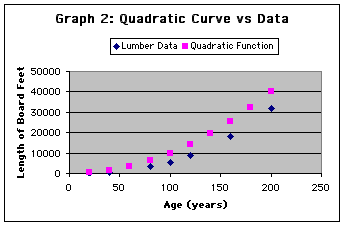
Since the difference between the quadratic curve and the data from the lumber industry get further apart as the tree gets older, we do not need to plot the cubic curve. This is because the cube of the age will be even greater than the square of the age, thus the difference between the cube and the data will be even more.
Let's look at the exponential function.
The results looked like this:
| Age | Length | y=(0.000001)e^x |
| 20 | 100 | 485.16519540979 |
| 40 | 600 | 235385266837.02 |
| 60 | 114200738981568000000 | |
| 80 | 3300 | 5.54062238439351E+28 |
| 100 | 5600 | 2.68811714181614E+37 |
| 120 | 8800 | 1.30418087839363E+46 |
| 140 | 6.32743170715559E+54 | |
| 160 | 18200 | 3.06984964064424E+63 |
| 180 | 1.48938420078184E+72 | |
| 200 | 32000 | 7.22597376812575E+80 |
This is not close.
Let's look at the original data on a log-log scale.
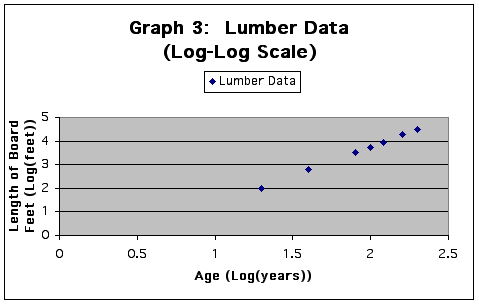
Now, this looks close to linear. Let's try to find an equation of a line to fit this data.
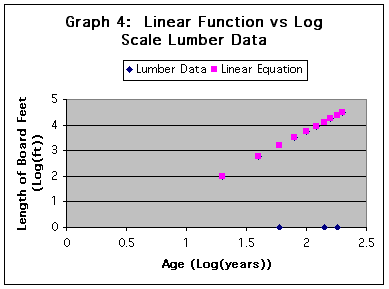
This appears to be a very close match. The equation used was y = 2.5(age)-1.25. Age is in the Log(years) and "y" represents the Log(length of board feet). The first equation I tried was y = 2.0(age)-1. This was based upon a visual inspection and subsequent calculation of the slope of the lumber data. It only took a couple of iterations to come up with the final equation used.
Now, we can go back and calculate the length of board feet for trees with any age. To get the length of board feet, we raise 10 to the power of the value of "y". A chart comparison looks like this:
| Age (years) |
Original Data Length of Board Feet (x 100) |
Calculated Length (x 100) |
| 20 | 1 | 1 |
| 40 | 6 | 6 |
| 60 | not available | 16 |
| 80 | 33 | 32 |
| 100 | 56 | 56 |
| 120 | 88 | 88 |
| 140 | not available | 130 |
| 160 | 182 | 182 |
| 180 | not available | 244 |
| 200 | 320 | 318 |
This calculation is very close to the actual recorded data by the lumber industry. Thus, the equation could be used to estimate the amount of wood a tree would yield base on its age.
Working with spreadsheets can be very useful when working with large data fields. The Chart Wizard on Microsoft Excel is easy to work with giving only minor problems at the begining. Also, when having trouble fitting a curve to your data, remember to try plotting the data on a log-log or semi-log scale to check to see if it approximates a linear function.