
Write-Up #12: Explorations with Excel
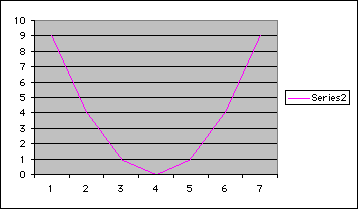
1. First we can investigate f(x) = (x) ^ 2 using the Excel Spreadsheet. If we have tabular values for x, we can construct a chart using Excel and the function as follows:
| X | Y |
| -3 | 9 |
| -2 | 4 |
| -1 | 1 |
| 0 | 0 |
| 1 | 1 |
| 2 | 4 |
| 3 | 9 |
By using the Graphing Wizard, we can construct a graph by connecting the data points.

2. If we investigate the following polar coordinate equation
we can place on spread sheet with 0.01 radians in the first column and the second column as the functional value. Then we increase the radians by .01 to obtain the following:

which produces the following graph as a "Radar Graph" (Chart Wizard icon):

3.Given the following data for predictions of the number of board feet (in 100's) depending on the age of the trees.
| Age of Tree | 100s Board Feet |
| 20 | 1 |
| 40 | 6 |
| 60 | |
| 80 | 33 |
| 100 | 56 |
| 120 | 88 |
| 140 | |
| 160 | 182 |
| 180 | |
| 200 | 320 |

Excel has the capacity to curve-fit the data with a power function as shown on the graph. As a result of the function, the missing data can be estimated and rounded as shown in the third column. Hence, the data for tree ages 60, 140, and 180 are estimated, below.
| Age of Tree | 100s Board Feet | Adjust Data |
| 20 | 1 | 1.026 |
| 40 | 6 | 5.77383840563218 |
| 60 | 15.8625165479802 | |
| 80 | 33 | 32.4924073434241 |
| 100 | 56 | 56.6669837236975 |
| 120 | 88 | 89.2666737375281 |
| 140 | 131.085370383987 | |
| 160 | 182 | 182.851763558389 |
| 180 | 245.243110365443 | |
| 200 | 320 | 318.894743621071 |
| 220 | 404.406966679918 | |
| 240 | 502.350242854558 |
In addition to estimating missing data (interpolation), we can project/predict the board feet for older trees (extrapolation) using the same prediction function for trees older than 200 years as was originally provided in the data.
4. The next example concerns an investigation of a certain technology company's value in the stock market. We have the following data: The first date is July '95 (Excel changed the date to "33419"), the second date is Jan '96 ("33603"), the third date is July '96 ("33785"), and so on.
We wish to interpolate the Dollar Value for July '97 ("34150") and extrapolate the value for January and July of 2000.
| Actual Date | Year-Date | Dollar Value | Calculated Val |
| 33419 | 95.5 | 96 | 97.8938500000149 |
| 33603 | 96 | 99.6 | 96.3744000000079 |
| 33785 | 96.5 | 110.4 | 98.1266500000056 |
| 33969 | 97 | 111.3 | 103.150600000001 |
| 34150 | 97.5 | 111.446250000015 | |
| 34334 | 98 | 121.2 | 123.013600000013 |
| 34515 | 98.5 | 138.1 | 137.852650000008 |
| 34699 | 99 | 152.4 | 155.963400000008 |
| 34880 | 99.5 | 189.3 | 177.345850000005 |
| 100 | 202.000000000015 | ||
| 100.5 | 229.925850000014 |
As a result of curve-fitting in Chart Wizard using the polynomial curve (second degree), we have the graph and formula as shown below:

The Calculated Value column is derived from the following formula, and data from the second column (Year-Date) is used to predict Dollar Value. The results are posted in the fourth column (Calculated Value).
We now have values for July '97 ($111.45) , Jan '00 ($202.00), and Jul '00 ($229.93).
RETURN to my Home Page.