Consider two point (3,4) and (-5,2). For any point (x,y) we can write the distance equations using a constant n.
Explore graphs with these two distance equations using Graphing Calculator 2.0. By using a slider variable n, the graph can be examined for non-zero constants.
The graph below represents the graphs of the equations if n=2.

Where as the following graph represents the equation if n=5.

The next graph represents the equation if n=7.

Once the graphs of the equations are observed using different non-zero constants, then consider the sum of the graphs.
![]()
This equation was graphed with the equation ![]() in order to make
a visual comparison.
in order to make
a visual comparison.


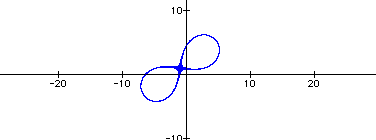
The product of the two equations give a different result. The blue graph represents the product of the two equations. The red graphs represent the circle and the purple represents the sum of the equations (n=27)


When n=25 a lemniscate appears.

Using the graphing calculator software, I was able to view the different values of n while looking at both the product and the sum of the two equations using a unit circle as a standard.