It has now become a rather standard exercise, with available technology, to construct graphs to consider the equation
for different values of a, b, or c as the other two are held constant.
From these graphs discussion of the patterns for the roots of ![]() can
be followed.
can
be followed.
For example, if we set ![]() for b = -3, -2, -1, 0, 1, 2, 3,
and overlay the graphs,
for b = -3, -2, -1, 0, 1, 2, 3,
and overlay the graphs,
the following picture is obtained.
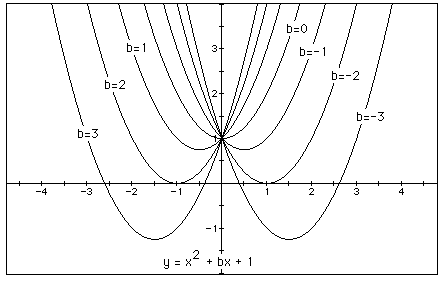
We can discuss the "movement" of a parabola as b is changed. The parabola always passes through the same point on the y-axis, i.e. the point (0,1) with this equation.
For b < -2 the parabola will intersect the x-axis in two points with positive x values (i.e. the original equation will have two real roots, both positive).
For b = -2, the parabola is tangent to the x-axis and so the original equation has one real and positive root at the point of tangency.
For -1 < b < 2, the parabola does not intersect the x-axis -- the original equation has no real roots.
For b = 2 , the parabola is tangent to the x-axis (one real negative root)
For b > 2, the parabola intersets the x-axis twice to show two negative real roots for each b.
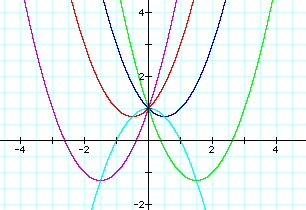
Students could actually continue this type of exercise for various other equations. Below is an example of Graphing Calculator 2.0 for the equations listed.

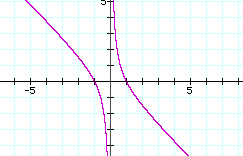
Graphs in the xb plane
Now let us consider again the equation
and solve for b and substitute b for y. Simplified the result is ![]()
Now graph this relation in the xb plane. We get the following graph.
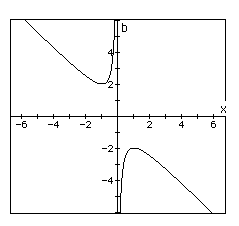
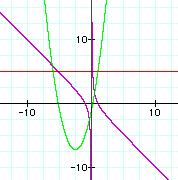
If we take any particular value of b (which we have substituted as y for the sake of graphing), say b = 3, and overlay this equation on the graph we add a line parallel to the x-axis. If it intersects the curve in the xb plane the intersection points correspond to the roots of the original equation for that value of b. We have the following graph.
For each value of b we select, we get a horizontal line. It is clear on a single graph that we get two negative real roots of the original equation when b > 2, one negative real root when b = 2, no real roots for -2 < b < 2, One positive real root when b = -2, and two positive real roots when b < -2.
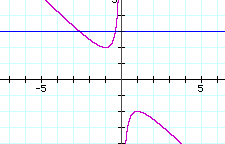
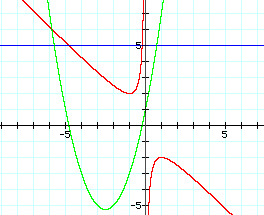
For example if b=5, notice that the intersection of the line y=5 and the orange curves correspond to the roots of the parabola.

If the equation is graphed in the xb plane, the following curves guide us to the roots of the equation at the value of b.
For example, the following equations are graphed
Notice that once again, the intersection of the line b=5 and the equation solved for b correspond to the roots of the equaiton.
Graphs in the xc plane
Consider an equation where c is unknown. For each value of c considered,
its graph will be a line crossing the parabola in 0, 1, or 2 points -- the
intersections being at the roots of the orignal equation at that value of
c. In the graph, the graph of c = 1 is shown. The equation
will have two negative roots -- approximately -0.2 and -4.8.
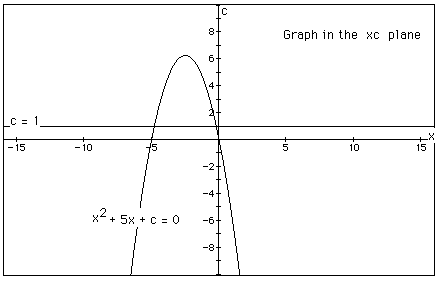
There is one value of c where the equation will have only 1 real root
-- at c = 6.25. For c > 6.25 the equation will have no real roots and
for c < 6.25 the equation will have two roots, both negative for 0 <
c < 6.25, one negative and one 0 when c = 0 and one negative and one
positive when c < 0.
Return to Home page