What happens when a function is made up of a combination two linear functions,
depends upon what the combination is. One would expect a different result
when the two functions are multiplied together as compared to when they
are divided. Different results would also be expected depending upon the
relation between the two functions. If the functions are the same except
for the constant, different results are expected from when the functions
have different constants but the same linear term.
A specific set of linear functions to examine are functions that are positive
multiples of each other. Given f(x) and g(x) as two linear functions, with
g(x) = c f(x), the four different combinations that I will examine are:
| i. | h(x) = f(x) + g(x) |
| ii. | h(x) = f(x)g(x) |
| iii. | h(x) = f(x)/g(x) |
| iv. | h(x) = f(g(x)) |
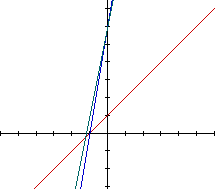
Let us first examine what happens when we add two functions that are
positive multiples of each other, h(x) = f(x) + g(x). One would expect the
slope and the y-intercept to increase from the original function. As c increases,
from g(x)= c f(x), the slope and y-intercept to increase, and they do. This
can be seen in the graph below. The red line is the original function, with
the successive lines being the sum of two linear functions. The purple line
has the smallest value of c, with c increasing until blue has the largest
value.
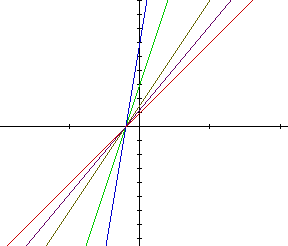
It is interesting to note that all of the x-intercepts are the same.
This is expected because g(x) is a multiple of f(x), so the value of both
functions, and their sum, will all be zero at the same x value.
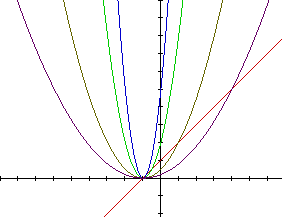
When we consider the product of two linear functions, we will end up with
a quadratic function that is a parabola. Once again, the shape of the graphs
is related to the multiple c that we use to relate the two functions. As
c increases, we expect to get narrower and narrower parabolas. The vertex
of all the parabolas should be in the same location, due to the functions
being multiples of each other. The blue line has the largest value for c,
and the graphs get wider for smaller values of c, with purple being the
smallest value of c.
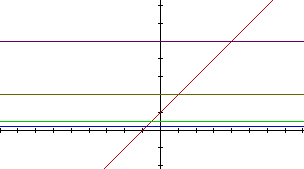
If the quotient of two linear functiions is analyzed, we expect to end
up with a series of horizontal lines. The values of these lines should simply
be 1/c because h(x) = f(x)/g(x) and g(x) = c f(x). These graphs can be seen
below.
We expect to get four linear equations when we look at f(g(x)). These
can be seen in the graph below. The y-intercepts are the same h(x) = f(x)
+ g(x) and h=f(g(x))
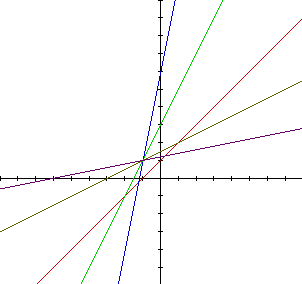
It is interesting to note that the four combinations of f(x) and g(x)
still intersect in one point. Another interesting point is that the y-intercepts
do not change, while the x-intercepts do between h(x) = f(x) + g(x) and
h=f(g(x)). An example graph is given below, the dark blue line is the function
h(x) = f(x) + g(x), while the aqua line is the function h=f(g(x)).
The combinations of positive multiples of the same linear function is not
as interesting as I had hoped. The results where some what predictable,
at least the first three graphs. I was somewhat surprised by the fourth
graph, but after looking at the specific functions, this was a result that
could be predicted algebraically.