Assignment #1 Problem #6
A discussion of the equation:

by: Kelli Nipper
Graph:
What do you expect to find for the graph of:
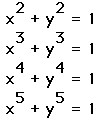
In this exploration, I began looking at the behavior of the graphs as
"a" increases. It was obvious right away that there were two sets
of behaviors. One, when "a" was even; and the other when it was
odd. Using the algebra expresser program, it was easy to form two hypotheses.
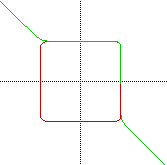
Hypothesis 1: For even integer values of "a".
The graph began as a circle, and started to flatten as "a" increased.
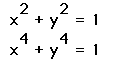
This is seen in the change between the graphs of:

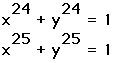
So you would expect the graph of "a"=24 to follow the pattern
by approaching a square as "a" increases:

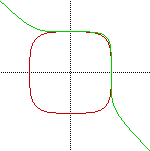
Hypothesis 2: For odd integer values of "a".
The graph began as a curve that was tangent to the preceding even power
graph at two points:

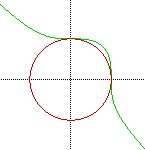
I predicted that the curve would continue to be tangent to the shape
as "a" increased. However, I was surprised to find that the curve
began to approach the assymptote with a trace around the shape formed by
the preceding even power relation.

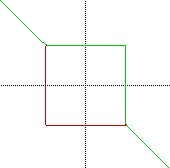
At this point, I concluded that as "a" increased (as and integer),
the relation would approach a square (for even values of "a")
and a straight line at y=-x with a trace around the preceding even power
graph between the values of -1 < x < 1 .
Graphing the equations of consecutive odd exponents on the same axis
leads to the observation that as "a" increases, the y value must
decrease for all odd values of "a".
To continue this investigation, I wanted
to know:
1) Are the behaviors consistent for values of "a" between 5 and
24?
2) How does the function perform for values of "a" > 25
3) How does the function perform for values of "a" that are not
whole numbers.
Using algebra Xpresser makes these easy to answer.
1) The behaviors were consistent for values of "a"
between 5 and 24.
The graphs of "a"=14 and 15 supports this conclusion:
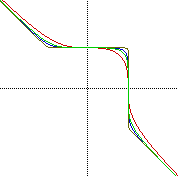
2) When "a">25, it performs as I concluded above. The
following is a graph of "a" = 50 and 51.
3) For non-whole number values, the graphs begin to enter the circle
created by the relation with
"a" = 2. Other patterns begin to form. It is important to mention
the following:
- for "a"= 0 there are no points that satisfy. This makes
sense because when any number is raised to the zero power, it is one. No
points will satisfy the values of 1+1=0.
- for positive and negative (non-whole number) values of "a"
the pattern begins a whole different discussion.
Return to Kelli's Class Page