

What would one think the graphs of the equation xy=ax+by+c would look like, for different values of a, b, and c? The easiest way to see how a, b, and c affect the graphs of the equation is to keep two of them constant and vary the third. To start, a and b will remain constant while c varies. Figure 1 shows multiple graphs of the equation for a=b=1 and c=.25, 1, 2, 3. The colors of the values of c just mentioned correspond to the same color in the figure.
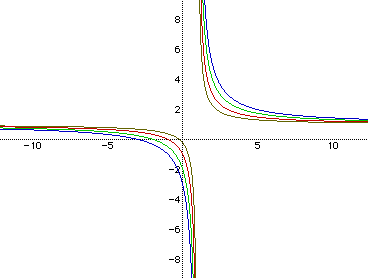
Just from looking at Figure 1, it seems as though there are two asymtotes. They look as though they are at x=1 and y=1. Figure 2 shows the same graphs as Figure 1 along with the lines for x=1 and y=1.
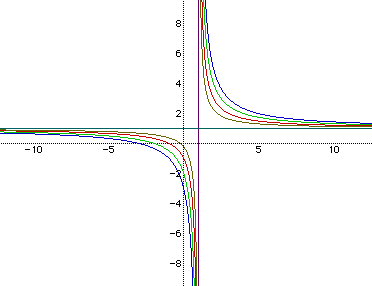
The lines of x=1 and y=1 are indeed the asymtotes of the graphs drawn in Figure 1. This can be seen by plugging 1 into the equation that we have been dealing with for the values of x and y and keeping a, b, and c the same as they were in the development of Figure 1. When all the values are plugged in, the left side of the equation has a value of 1 and the right side of the equation has a value other than 1. This tells us that the asymtotes must be x=1 and y=1.
When a and c are held constant and b is varied or b and c are held constant and a is varied, the graphs only have one asymtote in common. If a and c are held constant, the horizontal asymtote remains the same however the vertical asymtote changes for every different value of b. Also, if b and c are held constant, the vertical asymtote remains the same however the horizontal asymtote changes for every different value of a. This is shown in Figure 3 below. The graph on the left corresponds to when a and c are held constant and the graph on the right corresponds to when b and c are held constant.
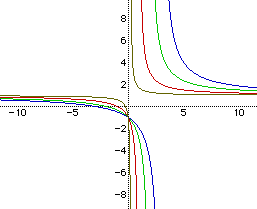
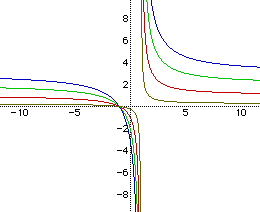
Notice how all the graphs on the left have a common horizontal asymtote of y=1 but do not have a common vertical asymtote and all the graphs on the right have a common vertical asymtote of x=1 but do not have a common horizontal asymtote. This can be derived once again by plugging in values for x and y into the equations for each graph.
What would you expect to happen if a=2, b=1, and c varied as before? What would the graphs look like? Can one make any connections between these graphs and the ones already described? Figure 4 demonstrates the graphs when a=2, b=1, and c varied as before.
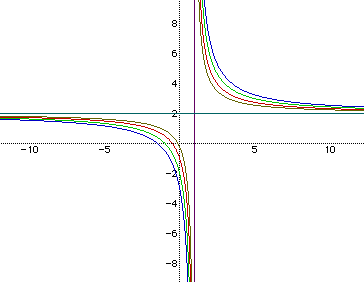
The colors of the graphs in Figure 4 correspond to c=.25, 1, 2, 3 as was the case in Figure 1. Look where the asymtotes are located now. They are at x=1 and y=2. This is different from before. In Figure 1, both a and b where equal to 1 and the asymtotes were at x=1 and y=1 and now in Figure 4, a=2 and b=1 and the asymtotes are at x=1 and y=2. Could there be a correlation between the value of a and b and the asymtotes? Let us look at a couple more examples before making statements about this.
Figure 5 displays graphs of a=1, b=2, and c varied as before.
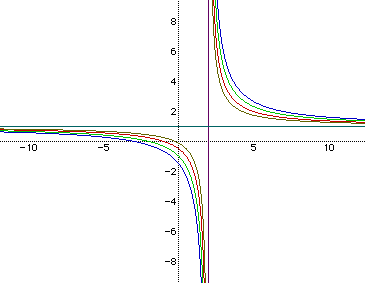
Notice that the asymtotes have changed again. The horizontal asymtote is now y=1 and the vertical asymtote is x=2. Now what would you expect if a=b=2 and c varied as before? In Figure 6, a=b=2 and c varies as before.
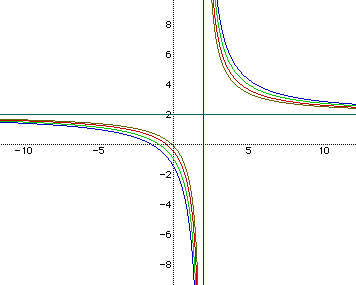
Now the asymtotes are located at x=2 and y=2.
From what was learned from the figures presented, one can determine the horizontal and vertical asymtotes. The horizontal asymtote is determined by the value of a and the vertical asymtote is determined the value of b. When a or b is negative, the method of determining asymtotes still holds even though it was not shown here. The reader can prove this or take it to be true.
When c is negative, nothing that has been discussed already changes. What this does is makes the graphs go to the asymtotes faster. This can be seen in Figure 7.
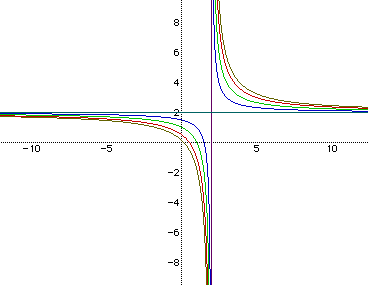
Another variation worth mentioning is when the left side of the equation equals the right side of the equation. How would think the graphs would look if the left and right side of the equation were equal? Figure 8 has the answer.
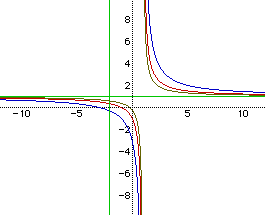
The green graph above is when the left and right sides of the equation are equal. The other three graphs are just like they have always been but the green graph becomes two straight lines of which one is an asymtote to the other graphs. By choosing different values for a, b, and c, one can get both sides of the equation to be equal with part of the graph being a vertical asymtote. This is left up to the reader to experiment further into.