

Polar equations can form many different and many times very pretty figures. One of the most well known polar equations is that of r=a+bcos(kt). This equation may be one of the most widely known of all polar equations because of what the equation creates when a and b are equal and k is an integer. This variation of the above mentioned equation creates what is known as an 'n-leaf rose'. Figure 1 illustrates the 'n-leaf rose' for values of k=1, 2, 3, 4, 5, and 6. These colors correspond with the colors of the colors in the graph.
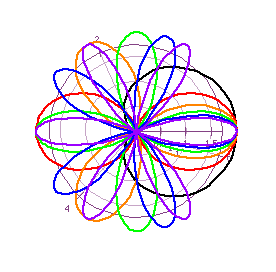
Notice that the value of k determines how many leaves the rose has. There is one leaf for k=1 and five leaves for k=5. This is what makes this variation of the equation so unique.
Now let us keep a and b the same once again but this time let k=.5, 1.5, 2.5, 3.5, 4.5, and 5.5. What would one think the graph will look like now? Using what was just found in Figure 1, one may want to hypothesize that there will only be a half of a leaf, one and half leaves, etc. Figure 2 will prove this hypothesis.
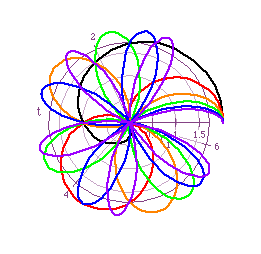
Only half of the first leaf of every graph is present when the values of k are half odd-integers. So, if a and b are equal, then the value of k will determine the number of leaves the 'n-leaf rose' will have. For this discussion it should be called a 'k-leaf rose'.
One last modification to the 'n-leaf rose' equation. What will happen when a=0 and b=1 for k=1, 2, 3, 4, 5, and 6? Or in other words, r=bcos(kt). Figure 3 shows the graphs of these equations.
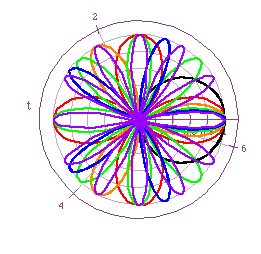
From this one can see that for odd values of k, there were k leaves drawn and for even values of k, there were 2k leaves drawn. When k is negative, nothing different is formed because all that a negative k means is all the angles will be negative and since cosine is positive in the first and fourth quadrants and negative in the second and third quadrants, the graph will just be just be traversed in the opposite direction it was when k was positive.
If one was to replace cos(kt) with sin(kt), using what you know about the relationship between sine and cosine, what would you expect the graphs to look like? You should know that sine and cosine are just phase shifts of each other. From this you should be able to determine what the graphs will look like now. If you are still not sure, take a look at Figure 4 for more incite.
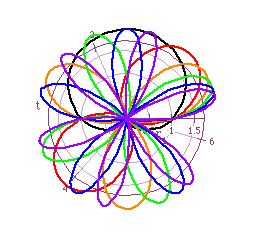
From this figure one can see that the graphs are shifted. When k=1, the graph shifted a full 90 degrees, however, all the other graphs shifted 90 divided by k degrees. Or 45 degrees for k=2, 30 degrees for k=3, etc.
For the next set of investigations, let a < b. This variation creates some very interesting graphs. Can you guess what they will look like for a=1 and b=2 and k=1, 2, 3, 4? Figure 5 demostrates what these values of a, b, and k create.
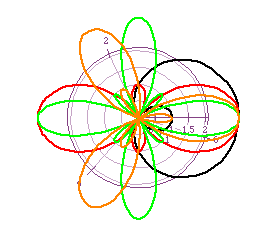
When a < b, for each integer value of k, there are 2k leaves in the graph of which half are larger than the other half. However, when k is odd, the half of the leaves that are smaller than the others are located inside the larger ones and when k is even, the half of the leaves that are smaller than the others are located between the larger leaves not inside them. If the value of a and/or b is made larger, the graphs become larger. This can be understood by letting t=0 and solving the equation. The cosine of zero is always 1, thus if a and/or b is larger, then the value of r becomes larger and the opposite is true also. If a and/or b become smaller, then the value of r becomes smaller.
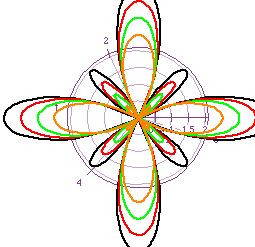
Just as an addition to what was just stated about r becoming larger and smaller, Figure 6 shows graphs for a=1, k=4 and b=1.5, 2, 2.5, and 3.
When k is rational, some very weird graphs are created. I am not sure what can be determined from them, so if the reader has any insight, I would appreciate hearing what you have found. Figure 7 shows some graphs of of the equation we have been using when a=1, b=2, and k is rational.
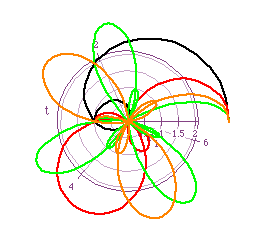
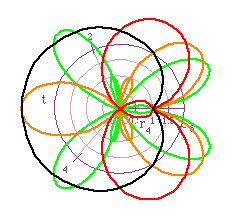
The graph on the left for cos(kt) and the one on the right is for sin(kt).
Another variation of the equation comes about when a > b. Using what has been discussed so far, what would you predict the graphs to look like in this case? To narrow the possibilities down a little, consider only those cases when a=2, b=1 and k=1, 2, 3, and 4 and only the graphs of cos(kt). Now what do think? Figure 8 can be of some help to you if you need some help.
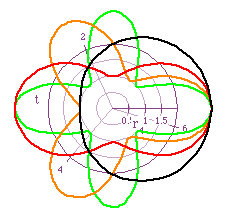
This is a quite interesting figure. Notice how none of the graphs touch the origin, unlike all of the previous graphs discussed. If the cos(kt) is replaced by sin(kt), one gets the same outcome as earlier in this discussion. The graphs of the cos(kt) are shifted by 90 divided by k degrees to form the graphs for the sin(kt). This is shown in Figure 9.
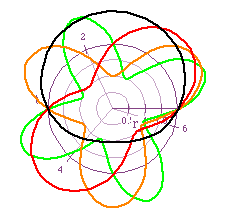
Now we take a look at the graphs when k is a rational. The graphs on the left in Figure 10 are for cos(kt) and the graphs on the right in Figure 10 are for sin(kt). The values of k used are k=.5, 1.5, 2.5, and 3.5.
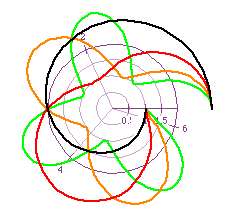
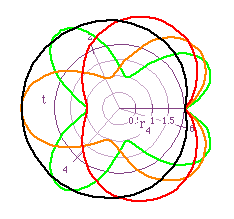
The graphs for cos(kt) are not closed and form some odd looking shapes. On the other hand, the graphs for sin(kt) are closed and form shapes similar to those created when k was an integer.
The investigations done here are only a few of the many one could do. My knowledge of polar equations is not real strong at this time so I would appreciate it if the reader has any questions, comments, suggestions, or incites to contact me at lrapley@aol.com.