Directions: Explore the following. Record your answers to the following explorations and be prepared to discuss your answers. You may need some particular pieces of information which can be found on the internet.
1. Trigonometry Ratios
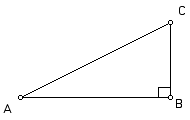
Sine, cosine, and tangent are functions which compare an angle in a right triangle to the ratio of two of the sides. On a calculator they are marked sin, cos, and tan, respectively. Using GSP, create and measure several right triangles (angles and sides). Find the sin, cos and tan of each acute angle and determine which side ratios they are each equal to. Explain a general rule for determining the sine, cosine, and tangent of an angle in a right triangle.
The slope of line AC is equivalent to which of these functions?
(Source: Intermath)

2. Surveying
The sine, cosine, and tangent functions have
a lot of real-world uses. Surveyors use the trigonmetric functions
a lot. For example, they can use trigonometry to figure out the
distance across rivers.
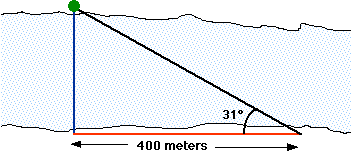
Surveyors first set up a survey post directly across the river
from some landmark (like a tree). Then they head downstream a
distance that they can measure; in this case, 400 meters. That's
the red horizontal line in the drawing. Now they take a sighting
on the tree from downstream. That's the black line in the drawing.
The surveying instruments will tell us what the sighting angle
is. In this case, it's 31 degrees.
What is the distance across the river?
Real world alert! Wouldn't it have been simpler to just tie a rope to the tree, climb into a boat, go across the river, and measure how much rope you trailed out? In this case, it actually might be a good idea to physically cross the river to check the answer from our math. This gives us confidence that trigonometry really works. After all, sometimes the real world gives us a river that is too difficult to cross or a cliff too dangerous to climb. In these cases the physical approach isn't possible. We need trigonometry--a mathematical technique we can trust for the answers we need.
(Source: J. David Eisenberg)
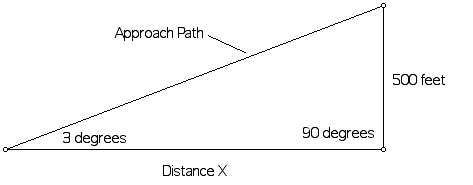
When approaching airports, pilots must learn to maneuver their aircraft visually, so that a stabilized approach to the runway can be flown at a constant approach angle. Precise approach planning insures a smooth transition to a landing within the Touchdown Zone of the runway. Pilots must sometimes execute visual approaches that are varied in size, shape, and angle based upon a variety of factors such as: other aircraft, obstructions, noise abatement, or prevailing weather conditions. The standard approach angle however, is 3 degrees. When flying a normal traffic pattern, the aircraft is maneuvered so that the final approach is intercepted at an altitude of 500 feet above the elevation of the airport.
In order to fly the standard 3 degrees approach, how long should the final approach segment be if the pilot plans to start the approach at 500 feet above the elevation of the airport?
(Source: Charles R. Moren)
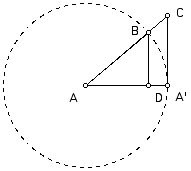
Using GSP, construct the figure below so that the length of line segment AB = 1.00 inch. Find the sin A, cos A and tan A and determine which side ratios they are each equal to. Move point B along the circle and describe what happens to the values of the trig functions.
(Source: Key Curriculum Press)
For a java-based interactive discussion, click here.
5. Latitude
Using trigonometry, calculate the circumference of the parallel of latitude at 34 degree North.
6. Towers
Fire towers are built so firefighters in forested regions can scan large areas for potential trouble. Assuming the atmosphere is clear and there are no hills or mountains obstructing the view, how for can you see to the horizon from the top of a 100 meter fire tower? From the top of a 55 story skyscraper, where each floor is 3 meters high? From the top of the tallest building in the world (the Petronis Tower in Kuala Lumpur, Malaysia, 1467 feet high)? From an airplane flying at 35000 feet? From the space shuttle at 300 kilometers?
(Source: Ralph Kahn)
7. Eratosthenes
The Greek philosopher, Eratosthenes, estimated the circumference of the earth around 330 B.C.E. Eratosthenes assumed the earth was a sphere and the suns ray are parallel when they reach the earth. He noted that the suns rays were perpendicular to the earth at city A at noon. The same time in the following year, he was in city B and measured the angle (3 degrees) at which the suns rays hit the earth. From this he calculated the circumference of the earth. Using GSP, show how to calculate the circumference of the earth from this data. Would Eratosthenes' method work if the earth was flat?
(Source: Lawrie Nickerson)
8. Sine Wave Tracer
Construct the sine wave tracer as follows:
1. Construct a horizontal line segment AB.
2. Construct a circle with center A and radius endpoint C.
3. Construct point D on AB and a line perpendicular to AB through
D.
4. Construct AE, with E on the circle.
5. Construct a line parallel to AB, through E.
6. Construct the point of intersection, F. If you consider your
circle to be a unit circle, the height of point F above AB is
the value of the sin A. Why?
7. Move point D so that it is just to the right of the circle.
8. Select point F and choose Trace Point in the Display Menu.
9. Select, in order, D, AB, E, and the circle.
10. Make an animation button that animates point D on AB, one-way,
and animates point E on the circle, one-way.
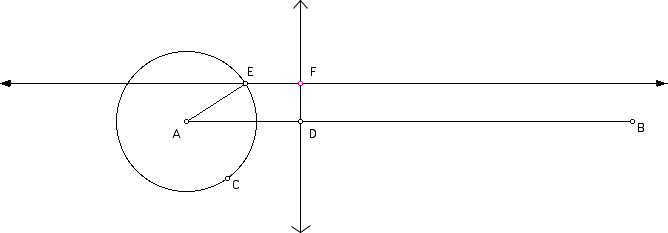
Try the animation with various size circles. Describe the locus of the curve.
(Source: Key Curriculum Press)
For a java-based interactive discussion, click here.
9. Modelling Weather Data
Download the excel file for the monthly average temperature for Athens, GA 1990 - 1997. The monthly averages are as follows:
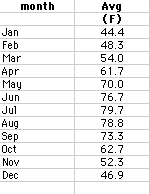
Temperature is a recurring cyclic event, so let's model it with the sine curve, y = a sin (bx + c) + d and compared it to the graph of the actual data. The above spreadsheet has already done this for you and the calculated data is as follows:
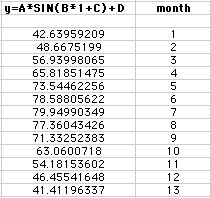
The spreadsheet looks like:
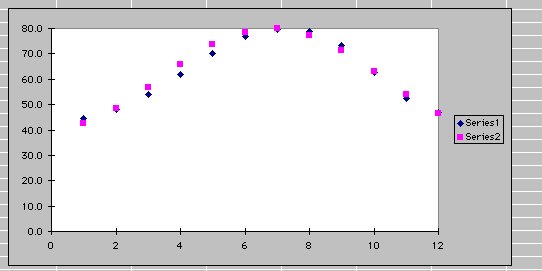
As you change the values for the parameters a, b, c, or d, you can see immediately how the changes affect the function with respect to how it models the actual data. Try to find the values for a, b, c, or d, so that there is a close agreement with the data. What are the values of these parameters?
Click here to find how I obtained the weather data.
For a java-based interactive discussion on frequency and amplitude, click here