http://www.john-weber.com
Class Activity #1
The following data represent the cholesterol readings (mg/dl) for randomly selected women from the
Framingham Heart Study:
| 287 | 242 | 200 | 260 | 298 | 278 | 195 | 265 | 300 | 215 | 224 |
| 228 | 291 | 236 | 244 | 234 | 278 | 302 | 281 | 217 | 221 | 156 |
| 198 | 267 | 198 | 204 | 280 | 182 | 185 | 256 | 234 | 172 | 225 |
- Use the TI-83 to help you construct a histogram using a class width of 19. Label the graph.
- Describe the shape. What are the center and spread? Are there outliers?
- Use the TI-83 to help you construct a histogram using a class width of 40. Label the graph.
- What happens to the histogram for different class widths?
- Use the TI-83 to help you construct a stemplot of the data. Use the stemplot to describe the shape. What are the center and
spread? Are there outliers?
Adapted from www.mathlab.isot.com/math/Statistics/Statlab2.pdf
ANSWERS:
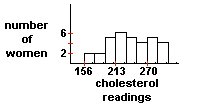
- The shape looks somewhat symmetric. There does not appear to be any possible outliers. The center is
234 and the spread is 156 – 302.
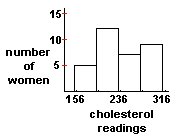
- The shape of the histogram changes.
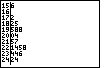
NOTE: The TI-83 does not completely construct the stemplot – you will need
to complete it. Here is the complete stemplot:
| 15 | | 6 | | | |
| 16 | | | | | |
| 17 | | 2 | | | |
| 18 | | 2 | 5 | | |
| 19 | | 5 | 8 | 8 | |
| 20 | | 0 | 4 | | |
| 21 | | 5 | 7 | | |
| 22 | | 1 | 4 | 5 | 8 |
| 23 | | 4 | 4 | 6 | |
| 24 | | 2 | 4 | | |
| 25 | | 6 | | | |
| 26 | | 0 | 5 | 7 | |
| 27 | | 8 | 8 | | |
| 28 | | 0 | 1 | 7 | |
| 29 | | 1 | 8 | | |
| 30 | | 0 | 2 | | |
156 is a possible outlier. The center is at 234 and the spread (without possible outliers) is
172 – 302. Without possible outliers, the shape is somewhat symmetric. With the possible outlier,
the distribution is left–skewed (i.e., the distance from center to the min is greater than the
distance from the center to the max).