http://www.john-weber.com
Class Activity #2
The following data are profits over the past 30 years in a small business (in thousands of dollars):
| 15 | 18 | 20 | 20 | 23 | 24 | 24 | 24 |
| 25 | 25 | 25 | 26 | 27 | 29 | 30 | 32 |
| 17 | 19 | 20 | 21 | 23 | 24 | 24 |
| 25 | 25 | 26 | 27 | 28 | 30 | 31 |
- Use the TI-83 to find the range.
- Use the TI-83 to determine the mean and standard deviation.
- Use the TI-83 to determine the five-number summary of the data. What do these numbers mean?
- Use the TI-83 to help you construct the boxplot.
- Are there possible outliers? How do you know?
Adapted from www.mathlab.isot.com/math/Statistics/Statlab3.pdf
ANSWERS:
- The range is 15 – 32.
- The mean is 24.23 and the standard deviation is 4.17.
- The five-number summary is 15 21 24.5 27 32.
15 is the minimum observation; 21 is the first quartile (Q1) – the observation below which one-fourth of
the observations lie; 24.5 is the median – the observation below which one-half of the observations lie; 21 is the
third quartile (Q3) – the observation above which one-fourth of the observations lie; and 32 is the
maximum observation.
- Here is the boxplot:
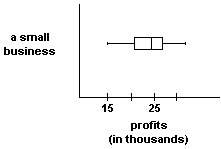
- There does not seem to be any outliers? There are no observations on the far-left or far-right that are separated
from the rest of the distribution.