http://www.john-weber.com
Class Activity #4
The following data represents the ages (in years) of seven men and their systolic blood pressures:
| Age, x | 16 | 25 | 39 | 45 | 49 | 64 | 70 |
| Systolic BP, y | 109 | 122 | 143 | 132 | 199 | 185 | 199 |
- Use the TI-83 to help you construct the scatterplot. Label the graph.
- Describe the overall pattern. Is there a direction to the relationship? If so, what is it? Is there an outlier?
- Suppose the men aged 25, 49 and 64 were smokers and the others were non-smokers. Show this on your scatterplot.
- Can you conclude anything about smokers and their systolic blood pressure? Why or why not.
Adapted from www.mathlab.isot.com/math/Statistics/Statlab4.pdf
ANSWERS:
- Here's the scatterplot:
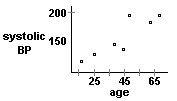
- The overall pattern is somewhat linear. There is a positive association to the relationship? There does
not seem to be an outlier.
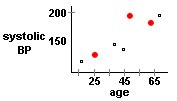
- We show the men aged 25, 49 and 64 (the smokers) by changing the square to a circle:
 .
.
- No you conclude anything about smokers and their systolic blood pressure because there does not
seem like there is a strong linear pattern among the smoker data – we would need more data.