 12
12Two-sample problems:
Assumptions for comparing two means:
Let x1 be the variable we measure from the first population and x2
be the variable we measure from the first population:
| Population | Variable | Mean | s.d. |
|---|---|---|---|
| 1 | x1 | μ1 | σ1 |
| 2 | x2 | μ2 | σ2 |
We use sample means and s.d. to estimate the parameters:
| Population | Sample Size | Sample Mean | Sample s.d. |
|---|---|---|---|
| 1 | n1 | 1 | s1 |
| 2 | n2 | 2 | s2 |
Suppose we want to infer something about the difference in population means (μ1 – μ2)
from the difference in sample means (1 –
2).
The sampling distribution of 1 –
2 has:
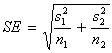
The two–sample t–statistic is:  .
.
If the two population distributions are both normal, then the two–sample t–statistic is normally distributed [i.e., N(0, 1)].
Unfortunately, the two-sample t–statistic does not have a t distribution. Even so, the two–sample t–statistic is used with the critical values from the t distribution. The book describes two options to do this (see pp. 394–395), but we will rely on the TI83 to calculate the p–value.
First, a level C CI for μ is x-bar ± t*×SE. The TI83 can calculate the two–sample t CI!
t–test for a population mean:
The null hypothes1s can be stated in two ways:


Recall: H0 and Ha always refer to the population and NOT to a particular outcome. It is often easier (and more appropriate) to state H0 and Ha before looking at the data.
A statistical inference procedure is called robust if the probability calculations do not change very much when the assumptions of the procedure are violated.