proportion
proportion
 12
12In this section, we discuss how to
Here are the parameters and statistics:
| Population | Population proportion | Sample Size | Sample proportion |
|---|---|---|---|
| 1 | p1 | n1 | 1 |
| 2 | p2 | n2 | 2 |
We use 1 –
2 to estimate p1 – p2.
1 –
2Here is the information about this sampling distribution:
1 –
2 is approximately normal1 –
2 is an
unbaised estimator of p1 – p2)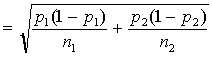 1 –
2
1 –
2Since p is NOT known, we need to use the standard error as an estimate of the s.d.:
SE = 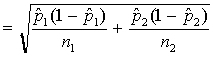 . This is valid because for large n,
is close to p.
. This is valid because for large n,
is close to p.
A level C CI for p1 – p2 is
1 –
2 ± z*×SE.
Luckily, the TI83 can calculate the two–sample proportion z CI!
Assumptions for the two–sample proportion CI:
1 –
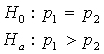
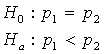
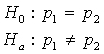
2The one–sample z–test for a population proportion:
If H0 is true, then all observations in both samples come from the same population. Thus,
the two samples can be pooled together. The pooled sample proportion is:
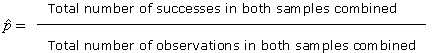 .
.
Thus, the z–statistic is: 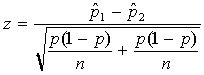 .
.
Recall: H0 and Ha always refer to the population and NOT to a particular outcome. It is often easier (and more appropriate) to state H0 and Ha before looking at the data.