expected countfor cell r,c
 .
.From previous sections, we know how to compare two populations. What if we wanted to compare more than two populations or more than two samples?!
There are two parts to multiple comparisons:
In this course, we will focus on the former.
A table with r rows and c columns of data is called an r × c table. The table contains r·c cells which contain the data. This table shows the relationship between categroical variables. The r × c cells are combinations of explanatory and response variables.
In hypothesis testing, we compare observed counts with expected counts.
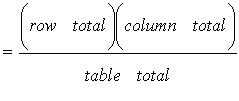
The expected count (when H0 is true) is determined by:
expected countfor cell r,c .