| 1/30 |
How to find scatteplot for question 2.13? |
The table shown is a simpler way to show this type of data. Note the first row – 12,000 is the
explanatory variable and it is associated with four (4) measures of the response variable. Likewise for
the second row – 16,000 is associated with four (4) measures of the response variable and the other
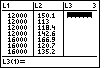
rows. To plot a scatterplot, type the explanatory variable into L1 and the response variable
into L2. Since 12,000 is associated with four (4) measures of the response variable, you need
to type 12,000 four times into L1; Since 16,000 is associated with four (4) measures of the
response variable, you need to type 16,000 four times into L1; etc. Then type in the response
variable measures into L2. Here's a picture of what your lists should look like:
 |