ASSIGNMENT # 12
Problem # 1
This assignment deals the use of spreadsheets in order to explore various
topics in mathematics. Indeed, a spreadsheet has the potential for being
a very rich tool for teachers of middle school and high school. The concept
of function is typically introduced in an Algebra I course, and students
construct graphs of these functions by creating an x-y table (sometimes
referred to as a t-table) and plotting points. A spreadsheet is nice in
that students may create extensive x-y charts, plot these points and draw
the graph, and then use the graph feature on the spreadsheet program to
verify their results. We may use EXCEL to input values of x and then generate
the corresponding values of y. Furthermore, EXCEL will generate a graph.
Consider the function

| -20 | -8000 |
| -19 | -6859 |
| -18 | -5832 |
| -17 | -4913 |
| -16 | -4096 |
| -15 | -3375 |
| -14 | -2744 |
| -13 | -2197 |
| -12 | -1728 |
| -11 | -1331 |
| -10 | -1000 |
| -9 | -729 |
| -8 | -512 |
| -7 | -343 |
| -6 | -216 |
| -5 | -125 |
| -4 | -64 |
| -3 | -27 |
| -2 | -8 |
| -1 | -1 |
| 0 |
0 |
| 1 | 1 |
| 2 | 8 |
| 3 | 27 |
| 4 | 64 |
| 5 |
125 |
| 6 | 216 |
| 7 | 343 |
| 8 | 512 |
| 9 | 729 |
| 10 | 1000 |
| 11 | 1331 |
| 12 | 1728 |
| 13 | 2197 |
| 14 | 2744 |
| 15 | 3375 |
| 16 | 4096 |
| 17 | 4913 |
| 18 | 5832 |
| 19 | 6859 |
| 20 | 8000 |
In the table above, the left-hand column contains the values of x and
the right-hand column contains the corresponding values of y. These y-values
are generated by taking each value of x and cubing it. Of course, this list
is not complete since it contains only the integers in the interval [-20,
20]; however, it will suffice for the graph.
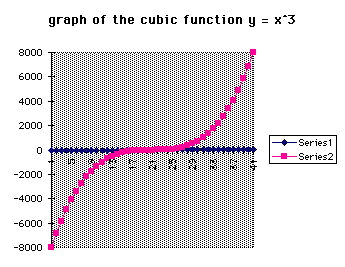
This graph should provide the students with a sense of what a graph of
the cubic function resembles. Moreover, there are many "gaps"
between the points and this could lead into a discussion about the domain
and the range not being limited to just the integers.
Now consider a smaller domain, say [-5, 5], and each element in the domain
has a common difference of .25. This will incorporate some values of x other
than just the integers.
| -5 | -125 |
| -4.75 | -107.171875 |
| -4.5 | -91.125 |
| -4.25 | -76.765625 |
| -4 | -64 |
| -3.75 | -52.734375 |
| -3.5 | -42.875 |
| -3.25 | -34.328125 |
| -3 | -27 |
| -2.75 | -20.796875 |
| -2.5 | -15.625 |
| -2.25 | -11.390625 |
| -2 | -8 |
| -1.75 | -5.359375 |
| -1.5 | -3.375 |
| -1.25 | -1.953125 |
| -1 | -1 |
| -0.75 | -0.421875 |
| -0.5 | -0.125 |
| -0.25 | -0.015625 |
| 0 | 0 |
| 0.25 | 0.015625 |
| 0.5 | 0.125 |
| 0.75 | 0.421875 |
| 1 | 1 |
| 1.25 | 1.953125 |
| 1.5 | 3.375 |
| 1.75 | 5.359375 |
| 2 | 8 |
| 2.25 | 11.390625 |
| 2.5 | 15.625 |
| 2.75 | 20.796875 |
| 3 | 27 |
| 3.25 | 34.328125 |
| 3.5 | 42.875 |
| 3.75 | 52.734375 |
| 4 | 64 |
| 4.25 | 76.765625 |
| 4.5 | 91.125 |
| 4.75 | 107.171875 |
| 5 | 125 |
Hopefully, the graph of this data will appear to be more continuous.
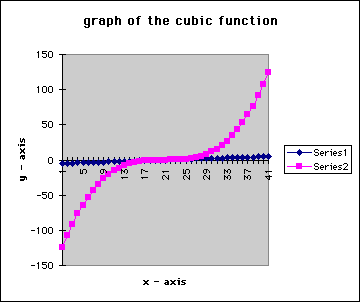
Here, we are able to see that the graph of the function has the same
general shape, and it appears to be more continuous than the first graph
of the cubic function.
CONCLUSIONS
Spreadsheets are nice tools for experimenting with graphing polynomial
functions. It reinforces the idea that the equation of a function simply
provides a rule, but the actual function is the set of points generated
by the rule. Moreover, students tend to choose some of the "easier"
values (meaning small integers) of x to create a t-table, whereas a spreadsheet
affords them the opportunity to explore rational numbers--large and small.
Return to Brian Wynne's Class
Page