The following graph shows the behavior of the function for a >
8:
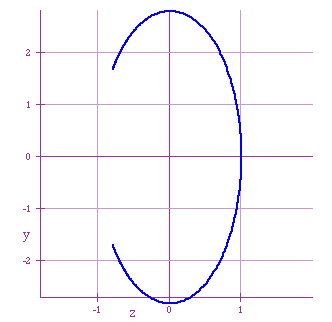
For 0 < a < 1, the 'inverted c' is inside the [-1, 1] x
[-1, 1] square. Negative values of a produce the same shape for the
graph (the difference is the order in which the points are drawn):
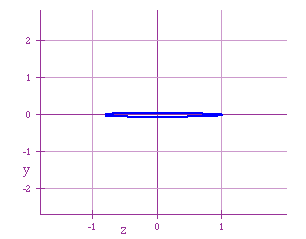
Observe that for values that are near to 0, the function will be a horizontal
line. The interesting thing is that no matter what value of a is chosen,
the inverted C always 'end' in the same point in the left. What is the value
of x? I got this, by using a zoom:
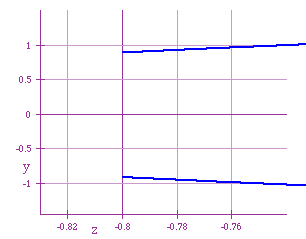
And for different values of a, I obtained the same value, x
=-0.8. Observe that for ![]() ,
,![]() . This explains the values -0.8
we had above.
. This explains the values -0.8
we had above.
So a affects only the height of our graph. That can be expected,
since a is on the definition of y.