Given a rectangular sheet of carboard, 15 in x 25 in, cut small squares of side x at each corner and fold up along the cuts to produce a lidless box. What is the size ox x that will give a box of 400 cu. in of volume and what is the values of x for which the box will have maximum volume.

Observe that the volume is then obtained by the expression: V(x) = x
(25 - 2x)(15 - 2x). We can analyze the graph of this expression as x varies.
(I will solve the problem without any help of derivatives; instead I will
take advantage the graphing capabilities of the spreadsheet for solving
it.)
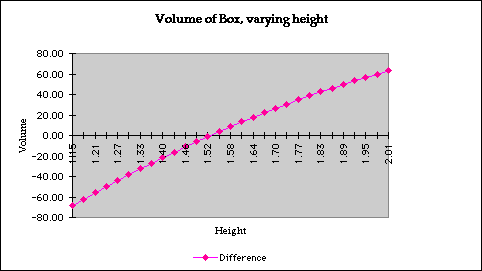
The pink graph shows the difference between the volume of the box and the
expected volume, of 400 cu. in. Notice that the values of x that we are
interested on are those for which the volume is positive, but also those
for which the construction of the box is possible. This gives 0 < x <
7.5, being the extreme values, 0, and 7.5 "deformed" boxes of
volume 0.

From the above graph you can see that there are 2 values of x for which the box will have a volume of 400 cu. in. One is between 1.15 and 2.23, and the other is between 4.38 and 5.46. Probably you have noticed that for solving the first question of the problem we need to see when the pink graph becomes 0. Let's take a closer look at one of those points:

A spreadseet can keep track of what values have been tested:

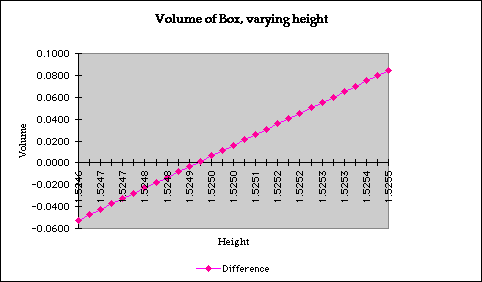
So this shows that the point should be around 1.52:

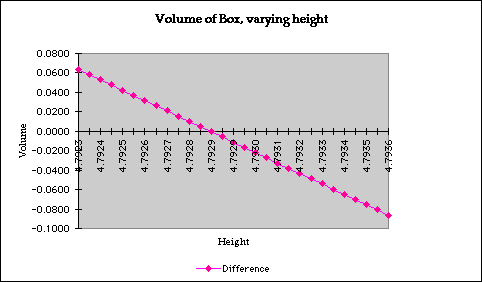
So one of the solutionswill be a number around 1.52495. In a similar
way the other solution can be found to be around 4.79285 (the difference
is around -0.0005)

The next question deals with the maximum of the function. I will use
a similar approach: to zoom near the maximum, and see first, what that value
is and second, at what value of x this value is attained.
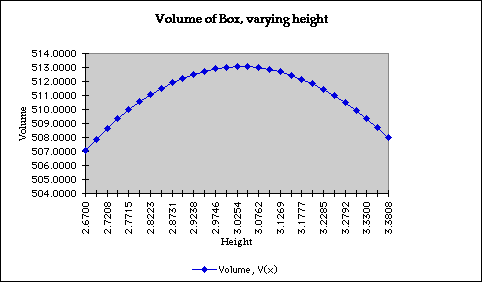
From our first graph we see that the maximum is between x=2.3 and 3.3:


Let's take a closer view:

So for a value of x near to 3.0342 we get a value for the volume of 513.0510.
You can find this values by yourself, interacting with the excel file that
contains the data. Just Click Here!