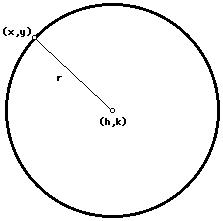
by definition, a point (x,y) is on this circle if and only if the distance
from (x,y) to (h,k) is r. Thus we have  or
or ![]() .
.
The center is the point (h,k) and the circle has radius r.
So, how is a circle formed from a plane intersecting a right circular cone.
The plane has to be parallel to the xy-plane, and for it to be a circle
z is not equal to 0. In this case, the intersection is a point.
So if the above equation is expanded, you get ![]() in which h, k, and
r are constants. Therefore, the general form for the equation of a circle
is
in which h, k, and
r are constants. Therefore, the general form for the equation of a circle
is
When the equation of a circle is given in general form, it can be rewritten
to find its center and radius by completing the square.

So, what do different values for D, E, and F do to the graph of the circle.
If E = 1, and F = 0 and we let D = -3, -2, -1, 1, 2, 3, you get the following
picture

It appears that the circle grows, but maintains the x-intercept values.
2 of the above equations are as follows

So, if we set x = 0 in both of these we get

And, therefore, our x-intercepts are the same.
If we complete the square on the above 2 equations we get the following
equations

The centers are at (-1/2, -1/2) and (1/2,-1/2) and radius (sqrt(2))/2.
We can go through a similar process to see what effect changes to the E
and F values have on the graph.
For a more geometric approach to circles, Click Here to view a 10-day unit
on the geometry of circles.
where a, b, and c are constrants and a is not zero. So all parabola's
are similar in shape to the graph of ![]() (As seen in the following picture).
(As seen in the following picture).

Here, the vertex is the point (0,0) and the axis of symetry is the y-axis.
By completing the square, the equation of the parabola
can be rewritten as
where the vertex of the parabola is (h,k) and the axis of symetry is
the line x=h. Let's look at a few graphs and do some algebra and see what
we can figure out about different values for a, b, and c using Algebra Expressor.
In the following picture I let b = 0, c = 0, while setting a = -3, -1, -1/2,
1/2, 1, and 3.

Therefore, you can see the parabola opens upward if a > 0 and downward
if a < 0.
There also appears to be another pattern. It looks like if the absolut value
of a is greater than 1 then the the curve is wider and if it is smaller
it is more narrow. Does this match what we know about parabolas?
In the next picture I let a = 1, c = 0, while setting b = 1

The equation of the above graph is
and if we complete the square, we get the equation
Therefore, our vertex is ( -1/2, -1/4) and the line of symetry is x =
-1/2. Is this reinforced by the graph? So, what is b doing to the graph.
It looks like setting b = 1 moved the graph of ![]() in the negative x direction
by 1/2 and the negative y direction by 1/4. What does other values for b
do?
in the negative x direction
by 1/2 and the negative y direction by 1/4. What does other values for b
do?
In the following picture a = 1, c = 0, and b = -3, -1, -1/2, 1/2, 1, and
3.

Therefore this is the picture of the graph of the following equations:

How is each equation moving the graph of the original equation in the
form ![]() . What if we were to complete the square for these equations? And, what
if we had a different value for a?
. What if we were to complete the square for these equations? And, what
if we had a different value for a?
In the following picture a = -1, c = 0, and b = -3, -1, -1/2, 1/2, 1, and
3.

Now, compare this with the previous graph. This is fairly reinforcing.
If we just look at the equation ![]() in which a = -1, b = -3 and c =
0, and
in which a = -1, b = -3 and c =
0, and ![]() we get the following picture
we get the following picture

If we complete the square of ![]() , we get the equation
, we get the equation ![]() .
.
So, what changes have the values of a and b made to the graph ![]() .
The negative appears to have inverted the graph. The gragh also appears
to be moved over to the left 3/2 and up 9/4. Where do these two graphs intersect?
If we set them equal to each other, they intersect at the points (0,0) and
(-3/2, 9/4).
.
The negative appears to have inverted the graph. The gragh also appears
to be moved over to the left 3/2 and up 9/4. Where do these two graphs intersect?
If we set them equal to each other, they intersect at the points (0,0) and
(-3/2, 9/4).
Maybe one more will help us make some decions about what is going on.
In the following picture a = 3, c = 0, and b = -3, -1, -1/2, 1/2, 1, and
3.

If we just look at the equation ![]() in which a = 3,
b = -1, and c = 0, and
in which a = 3,
b = -1, and c = 0, and ![]() we get the following picture.
we get the following picture.

If we complete the square of ![]() , we get the equation
, we get the equation
![]() .
.
So, what changes have the values of a and b made to the graph ![]() .The
graph appears to be moved over to the right 1/6 and down 1/12. What is different
about where these two graphs intersect?
.The
graph appears to be moved over to the right 1/6 and down 1/12. What is different
about where these two graphs intersect?
The 3 is what is making the graph of ![]() more narrow than
that of
more narrow than
that of ![]() .
.
Now let's look at different values for all a, b, and c for ![]() .
.
If we set a = 1, b = 1 and let c = -3, -1, -1/2, 0, 1/2, 1, 3 , we get the
following picture.

It is fairly easy to see what is going on with the c values.
There are also parabolas of the form
Such a parabola is expressed in the following picture

The equation of this parabola is ![]() . Similar investigations
can be done with a parabola whose directrix is parallel to the y-axis. The
investigations above involved parabolas whose directrix is parallel to the
x-axis
. Similar investigations
can be done with a parabola whose directrix is parallel to the y-axis. The
investigations above involved parabolas whose directrix is parallel to the
x-axis

Using the following columns

A more geometric definition of the parabola is the set of all points in the plane equally distant from a fixed line and a fixed point not on the line. The fixed line is called the directrix. The fixed point is called the focus. The following is part of a parabola created using GSP.

I started with line AB and a point C on that line. I constructed a perpendicular
line k to line AB through C. Then I pick an arbitrary point not on the line
which will be the focus, point D. Find the midpoint on the segment CD and
construct the perpendicular through this point, F. Where this line intersects
k is the point, G, of tangency, and the perpendicular, m, through F is the
line tangent to the parabola. Click here to view
the animation in GSP. As C moves along AB G traces the parabola.
 , when the major axis is parallel to the x-axis
 , when the major axis is parallel to the y-axis
The equation of this ellipse is ![]() .
.
Another example is ![]() as follows
as follows

A more geometric definition of the ellipse is the set of all points in the plane, the sum of whose distances from two fixed points is constant. Each fixed point is called a focus. The following is an ellipse created using GSP.

The construcstion is as follows:
Construct any point C on the circle. Construct a segment through point
C and the center of the circle, A. Construct another point D within the
circle. Construct segment CD. Find the midpoint, F, of this segment.
Construct the line perpendicular to CD, through F. Find the point of intersection
of this line with the line through CA. Trace that point, H, as the point
C travels along the circumference of the circle.
The following is the picture with the appropriate labels.

D and A are the foci, and V1-V4 are the vertices. H is the point that
defines the ellipse.
Click here to view the GSP file that demonstrates
this. As D is moved within the circle, you will get a different ellipse
as seen in the following picture.

 , when the transverse axis is parallel to the x-axis,
 , when the tansverse axis is parallel to the y-axis.
The equation of this hyberbola is ![]()

The equation of this hyberbola is ![]() .
.
A more geometric definition of a hyperbola is the set of all points in
the plane, the difference of whose distances from two fixed points is a
positive constant. How can we use the GSP construction above to create
a hyperbola.

The above hyberbola was constructed by moving the point in the ellipse construction above outside the circle. The following is the picture with the appropriate labels.

As D is moved around on the outside of the circle, you will get a different hyberbola. Click here to view the GSP file that demonstrates this. The following is an example of such a hyberbola.

And that concludes my investigation of conics. Of course, you can see
that there are several different ways you can explore conics using different
computer software.